University of the Witwatersrand · Future Ecosystems for Africa
Explore the possibilities of sustainable land use
Compare African catchment data across reference, current and target scenarios — on a map, in charts, on dials, and in the numbers behind them.
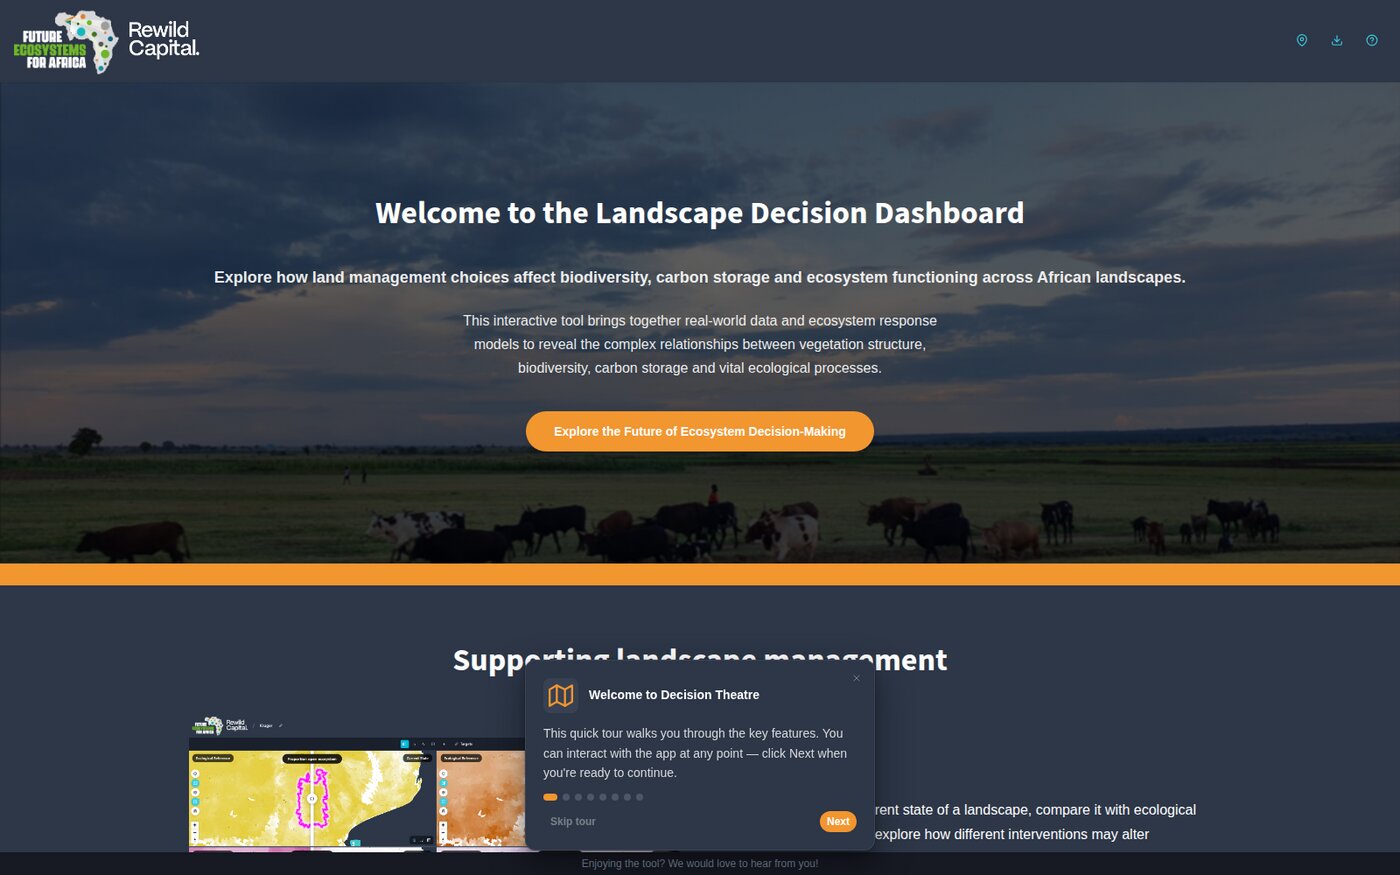






What it is
Landscape Decision Theatre is a decision-support tool for freshwater catchment management across Africa. It puts roughly 148,000 catchments and their indicators in front of researchers, policy makers and stakeholders, so a question like what happens to methane production if we restore tree cover here? can be asked and answered in one session.
You define a site — a study area — once. Every view, statistic and target is then computed for it: an area-weighted aggregate over exactly the catchments your boundary covers.
Nothing needs installing. It runs at africanlandscapefutures.wits.ac.za.
-
Start here
Fourteen short steps from opening the dashboard to setting your own targets. No installation, no configuration.
-
Look something up
Every control, panel and toolbar explained, with screenshots.
-
Run or deploy it
Assemble and validate a data directory, or serve the application to others.
-
Change the code
A Nix flake pins the whole toolchain. Architecture, testing, release process.
What you can do with it
-
Compare scenarios
Ecological reference, current state and your own target state — side by side under a draggable divider, on one synchronised map.
-
Read it four ways
Choropleth map, line and boxplot charts, dial gauges against a healthy range, and the per-catchment table behind the aggregate.
-
Define a study area
Draw it, select whole catchments, or upload a shapefile or GeoJSON. The server works out membership and overlap.
-
Set targets
Change an ideal value and the ecological consequences recalculate — dependent factors move with it, and implausible targets raise a warning.
-
Watch several factors at once
Up to six independent panes, each with its own factor, scenario and view mode.
-
Learn from real examples
Four guided tours over prepared demo sites — Munywana, Viphya, Shai Hills and a continent-scale Africa view.
Built on
-
A single Go binary
HTTP server, tile server and the analytical engine — with the interface and this documentation embedded. No database or runtime to install.
-
Vector tiles
MapLibre GL JS over MBTiles, with a GeoPackage carrying the scenario data and a spatial index behind every viewport query.
-
A reproducible toolchain
A Nix flake pins Go, Node, the documentation toolchain and the geospatial utilities, so a checkout builds identically anywhere.