Architecture Overview
Landscape Decision Theatre separates a Go backend, a React/TypeScript frontend, and a file-based data layer. The Go binary embeds the built frontend and this documentation site, so a release ships as a single self-contained executable.
For the rule governing which side of that boundary a given piece of work belongs on, see Client/Server Boundary.
High-Level Diagram
graph TB
    subgraph Desktop
        WV[WebView Window]
    end

    subgraph Go Binary
        MAIN[main.go] --> SRV[HTTP Server]
        SRV --> API[REST API handlers]
        SRV --> TILES[MBTiles tile server]
        SRV --> AUX[Aux tile servers x3]
        SRV --> GLYPH[Glyph proxy]
        SRV --> STATIC[Embedded SPA]
        SRV --> DOCS[Embedded docs site]
        SRV --> FILES[Static data dirs]
        API --> GEO[GeoPackage store]
        API --> SITE[Site store]
    end

    subgraph Frontend SPA
        APP[App.tsx] --> LAND[LandingPage]
        APP --> SITES[SitesPage]
        APP --> CREATE[SiteCreationPage]
        APP --> IND[IndicatorEditorPage]
        APP --> CA[ContentArea]
        CA --> VP[ViewPane]
        VP --> MAP[MapView]
        VP --> CHT[ChartView]
        VP --> DIAL[DialChart]
        VP --> TBL[AggregateTable]
        APP --> CP[ControlPanel]
        APP --> HDR[Header]
        APP --> SG[SetupGuide]
        MAP --> ML[MapLibre GL JS]
    end

    WV -->|HTTP| SRV
    STATIC -->|serves| APP
    ML -->|/tiles/| TILES
    ML -->|/fonts/| GLYPH
    APP -->|/api/| API
APP -->|/data/images/| FILESRuntimes
The same binary and the same SPA serve two runtimes, distinguished at run time by frontend/src/types/runtime.ts:
| Runtime | Window | Site storage |
|---|---|---|
| WebView (desktop) | native window opened by main.go | JSON files under data/sites/ |
| Browser (server) | user's own browser, --headless | localStorage |
Both runtimes talk to the same Go server for all analytical work. The browser runtime is not an offline mode — every indicator extraction, choropleth query and aggregation still requires the backend.
Expected to change
Browser-runtime site storage is being reworked. The client will persist the site definition plus a sparse map of user-set values rather than the full per-catchment matrix, and is expected to move from localStorage to IndexedDB.
Tickets: Full per-catchment analytics are persisted client-side at 27-56 KB per catchment, Move client-side persistence off localStorage onto IndexedDB.
Request Flow
- The Go binary starts an HTTP server on the configured port (default
8080,--portto change). - In desktop mode a native WebView window opens pointing at
http://localhost:<port>. With--headless, no window is opened and the user browses to the port directly. - The server serves the embedded React SPA for all routes not matching an API, tile, data or docs prefix.
- The user lands on the Landing Page and navigates to Your Sites.
- Site data is read and written via
/api/sites/…in the WebView runtime, or directly inlocalStoragein the browser runtime. - MapLibre GL JS requests vector tiles from
/tiles/{name}/{z}/{x}/{y}.pbfand font glyphs from/fonts/{fontstack}/{range}.pbf. - Choropleth, aggregate and comparison data are queried from the GeoPackage over
/api/. - All data is read from local files — MBTiles, GeoPackage, and site JSON.
Map Rendering Architecture
Each MapView owns a left map and, only while the compare swiper is on, a right one. The right instance is created on entering compare mode and removed on leaving it, and a pane releases its maps entirely once it has stopped displaying one (after a short grace period, so flipping to a chart and straight back does not reload the map). A recreated map opens at the last view the sync registry saw, so the release is invisible.
The ceiling is therefore panes currently showing a map x (compare mode ? 2 : 1), not a flat twelve. Grid view with all six panes on a map and the swiper on still reaches twelve; browsers cap simultaneous WebGL contexts at around sixteen and silently drop the oldest past that, so the swiper default (on, in App.tsx) is worth knowing about when diagnosing context loss.
- Base layers (MapLibre GL JS) — ecoregions, countries, rivers, lakes, catchment outlines, populated places, served from MBTiles via
/tiles/. -
Choropleth layer — catchment polygons coloured by a data-driven
fill-colorexpression built inbuildFillColorExpression(frontend/src/lib/choroplethPaint.ts). Colouring happens GPU-side; there is no per-feature JavaScript. The polygons reach the map by one of two transports, chosen by zoom:- Vector tiles, from the tiled zoom range up (
catchments_lev12inafrica.mbtiles, zoom 8-15 as generated). MapLibre fetches and tessellates each tile once and reuses it for every later pan, zoom and attribute change. The attribute values are fetched separately from/api/catchment-values— geometry-free — and joined onto the tiles as feature state, so switching indicator moves values only and never geometry. - GeoJSON, below the tiled zoom range, from
/api/choropleth. There the server returns grid-aggregated cells rather than catchments (seequeryCatchmentsGridAggregated), which have no tiled equivalent.
The choice is made from the served TileJSON: if the tileset does not declare a
catchments_lev12layer with its zoom range, the GeoJSON path is used at every zoom, exactly as before. A datapack built before catchments were tiled keeps working. - Vector tiles, from the tiled zoom range up (
-
3D extrusion (optional) — catchments extruded by indicator value.
- Site boundary and edit handles — small GeoJSON sources holding the user's own polygon.
Auxiliary Tile Servers
startAuxTileServers opens up to three additional listeners on the ports immediately following the main port, each running a minimal router that serves only /tiles/…. Browsers cap concurrent connections per origin, and grid view issues tile requests from many map instances at once; spreading them across origins avoids head-of-line blocking.
These auxiliary listeners are started once at boot and are not rebuilt when a data pack is installed.
Expected to change
The auxiliary routers are not rebuilt by rebuildRoutes, so their tile route survives a data pack install pointing at a store that has been torn down.
Ticket: Nil dereference and data race on tileStore during datapack install.
Factor Selection: metadata.csv to Chart View
Every dropdown in the control panel resolves back to one row of data/metadata.csv. This section traces that row from disk into the selector a user actually clicks, and shows where Chart View and Map View diverge. For the full column-by-column semantics of metadata.csv, see the Datapack Format reference.
flowchart TB
    subgraph Data Sources
        CSV[("data/metadata.csv")]
        GPKG[("GeoPackage<br/>scenario_current / scenario_reference")]
    end

    subgraph Go Backend
        CACHE["loadMetadataCache()<br/>internal/api/metadata_cache.go"]
        METAAPI["GET /api/metadata/*<br/>canmap · cangraph · variabletypes<br/>groupingvariables · axislabels · units<br/>charttypes · colors · targetranges · ..."]
        COLAPI["GET /api/columns"]
    end

    subgraph React Frontend
        HOOKS["useApi.ts hooks<br/>useAttributeCanGraph, useAttributeVariableTypes, ..."]
        CP["ControlPanel.tsx"]
        STATE["App.tsx state<br/>chartGroups[] · chartAxisLabelFilters[] · paneStates[].attribute"]
        CV["ChartView.tsx"]
        MV["MapView.tsx"]
    end

    CSV --> CACHE --> METAAPI
    GPKG --> COLAPI
    METAAPI --> HOOKS
    COLAPI --> HOOKS
    HOOKS --> CP
    CP --> STATE
    STATE --> CV
    STATE --> MV
    HOOKS --> CV
loadMetadataCache() parses the CSV once at startup into 15 in-memory maps keyed by ColumnName (colours, labels, chart types, grouping variables, target ranges, and so on), each served over its own GET /api/metadata/* route. GET /api/columns is separate and comes from the GeoPackage, not the CSV — it is the authoritative list of attribute columns that actually exist in the data. A column can exist in the data but never appear in either selector if it is missing from, or zero-flagged in, metadata.csv. ControlPanel.tsx and ChartView.tsx each call the useApi.ts hooks independently; there is no shared metadata context, so both must derive from the same underlying maps rather than from shared state.
ControlPanel.tsx builds a different selector depending on viewMode:
flowchart TD
    VM{viewMode}
    VM -->|chart| CG["graphthisYN (canGraph) == true"]
    VM -->|map / dial / table| CM["MapthisYN (canMap) == true<br/>dial mode also requires typeofgraph to contain 'dial'"]

    CG --> IF{Individual Factor<br/>or Variable Type?}
    IF -->|Individual Factor| ONE["Pick one column directly<br/>auto-derives its VariableType as chartGroup"]
    IF -->|Variable Type| VT["VARIABLE TYPE select<br/>(VariableType_highest level of grouping)"]
    VT --> GV["GROUPING VARIABLE select<br/>(Grouping variable, filtered by VariableType)"]
    GV --> GROUP["groupedDisplayColumns:<br/>every column sharing that Grouping variable"]

CM --> FACTOR["single FACTOR select<br/>no grouping drill-down; table mode applies no filter at all"]- Chart View filters candidate columns by
graphthisYN. Picking a single factor directly auto-derives itsVariableType_highest level of grouping; alternatively the user narrows by VARIABLE TYPE then GROUPING VARIABLE, which selects a whole group of columns to plot together as one grouped line or boxplot chart. A Line/Boxplot toggle appears only whentypeofgraphfor the relevant columns containsline/boxplot. - Map / Dial / Table View filters by
MapthisYNinstead, with dial mode further requiringtypeofgraphto containdial. There is no variable-type/grouping-variable drill-down — just one flat FACTOR list. Table mode applies no metadata filter at all.
The resulting selection is written into App.tsx state (chartGroups[], chartAxisLabelFilters[], paneStates[].attribute) and persisted to localStorage (dt-pane-states) — identically in both runtimes, since both talk to the same running Go server for metadata.csv data. Only site persistence differs between runtimes.
ChartView.tsx then re-fetches the same metadata hooks independently and intersects GET /api/columns with the selected chartGroup/chartAxisLabelFilter to compute groupedDisplayColumns, resolving each column's axis label, units, x_axis tick, and MappreferredColour to build the final Plotly traces.
Package Layout
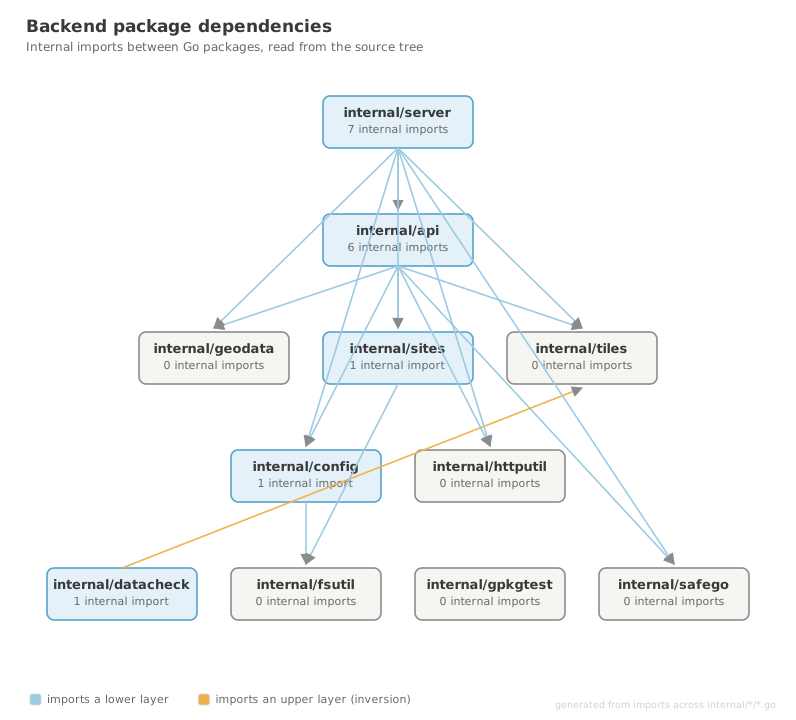
internal/ import graph. An amber arrow would indicate a layering inversion; there are none today. .
├── main.go # Entry point, CLI flags, WebView/headless mode
├── internal/
│ ├── api/ # REST handlers, metadata cache, recalculation
│ │ ├── handler.go # Route registration and HTTP handlers
│ │ ├── metadata_cache.go # metadata.csv parsing and lookup maps
│ │ ├── lookups.go # Lookup table loading (herbivore traits, NPP/SOC)
│ │ ├── recalculate.go # Ecological recalculation workflows
│ │ └── warnings.go # Target-state warning rules
│ ├── config/ # Platform config/data dirs, settings.json
│ ├── geodata/ # GeoPackage queries, choropleth, grid aggregation
│ │ └── gpkg_store.go # The bulk of the spatial and aggregation logic
│ ├── httputil/ # JSON response helpers
│ ├── server/ # HTTP server, routing, embeds, datapack install
│ │ ├── server.go # Routing, tile serving, style/glyph endpoints
│ │ └── datapack.go # Data pack download, install, extraction
│ ├── sites/ # Site JSON persistence, thumbnails, bounding boxes
│ └── tiles/ # MBTiles reader (SQLite) and tile cache
├── frontend/
│ └── src/
│ ├── App.tsx # Root component, page routing, global state
│ ├── components/ # 27 components (see Software Components)
│ ├── hooks/
│ │ ├── useApi.ts # API client and site persistence
│ │ └── useMapSync.ts # Left/right map viewport synchronisation
│ ├── lib/ # mapBounds.ts, ttlCache.ts
│ ├── utils/ # indicators.ts (AOI weighting), warnings.ts
│ ├── constants/ # calculationFormulas.ts, walkthroughSites.ts
│ ├── styles/ # theme.ts, colors.ts
│ └── types/ # index.ts, runtime.ts
├── data/ # Data pack contents (not in version control)
│ ├── mbtiles/ # *.mbtiles + style.json
│ ├── sites/ # Site JSON files (WebView runtime)
│ ├── images/ # Site thumbnails
│ ├── walkthroughs/ # Read-only demo site JSON
│ └── demo/ # Demo assets for guided tours
├── docs/ # This documentation site (MkDocs)
├── flake.nix # Nix build definition
└── Makefile # Dev iteration shortcuts
internal/webview_go/
A vendored copy of the webview library also exists in the tree. Its replace directive is commented out in go.mod, so nothing imports it and it is not part of the build. It is slated for removal — ticket Delete dead Go code — unreachable WKB parser and the vendored webview tree.
Embedding Strategy
The frontend is built to static files (frontend/dist/) and copied into internal/server/static/ before the Go build. The MkDocs site is built and copied to internal/server/docs_site/. Go's //go:embed directive bundles both into the binary, making it fully self-contained and serving the docs at /docs/.
Because internal/server/static/ is a build artefact and is not committed, go build, go vet and go test on a clean checkout require the frontend to be built first. See Development Environment.
Graceful Shutdown
The application handles SIGINT and SIGTERM. In desktop mode, closing the WebView window also triggers a clean server shutdown, closing the MBTiles and GeoPackage handles.