Datapack Format
A datapack is the self-contained data bundle that Decision Theatre loads at startup. It provides all scenario metrics, catchment geometries, map tiles, and display metadata that the application needs to run. This page documents every file in a datapack, what it contains, and how the application uses it.
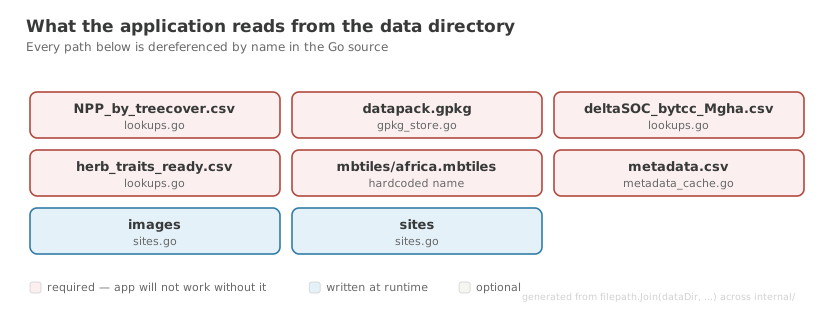
filepath.Join(dataDir, …) in the Go source. File Structure
A datapack is distributed as a compressed archive (.zip or .7z) with the following layout:
decision-theatre-data-v{VERSION}/
└── data/
    ├── datapack.gpkg           # GeoPackage: catchment geometries + all scenario data
    └── mbtiles/
        ├── africa.mbtiles      # Vector tile archive for the background map
        └── style.json          # MapLibre GL style config for map rendering
The sites/, projects/, and images/ directories are not distributed — the application creates them at runtime for user-saved content.
Input Files (Build-Time)
These files are consumed by scripts/build-geopackage.sh to produce datapack.gpkg. They are not shipped in the final archive.
Scenario Data
| File | Required | Description |
|---|---|---|
catchments.gpkg | Yes | GeoPackage containing catchment polygon geometries in a layer named catchments_lev12. Each feature must have a HYBAS_ID attribute that cross-references the CSV catchID column. |
current.csv | Yes | Per-catchment indicator values for the current scenario. |
reference.csv | Yes | Per-catchment indicator values for the reference (historical baseline) scenario. |
current_lower.csv | Yes | Lower-bound uncertainty values for the current scenario (used for whisker plots). |
current_upper.csv | Yes | Upper-bound uncertainty values for the current scenario. |
reference_lower.csv | Yes | Lower-bound uncertainty values for the reference scenario. |
reference_upper.csv | Yes | Upper-bound uncertainty values for the reference scenario. |
metadata.csv | Yes | Human-readable descriptions, display settings, and UI behaviour flags for each indicator column. Without it the app still works, but uses raw column names in the UI with no colour coding, chart type detection, or user-editable targets. |
Scenario CSV Format
All scenario CSVs share the same structure:
- First column:
catchID— the catchment identifier. Must matchHYBAS_IDincatchments.gpkg. - Remaining columns: one column per indicator, named consistently across all CSV files.
NAstrings are treated as missing and stored as SQLNULL.- All data columns are stored as
REALin the database.
"catchID","lowTC_prop","highTC_prop","meanTC",...
1121879850,0.61,0.39,14.2,...
1121881430,0.69,0.31,10.5,...
Ecological Lookup Tables
These three files support the cascading recalculation workflow triggered when a user adjusts a target indicator in the site editor. They are loaded at startup from the data/ directory alongside the GeoPackage. All three are optional — if any file is absent the application falls back to proportional scaling for the affected calculations.
| File | Required | Description |
|---|---|---|
NPP_by_treecover.csv | Yes | Per-catchment net primary productivity (NPP, g/m²) broken down by ten tree-cover class bins. Used to recalculate NPP when the user adjusts tree-cover targets. |
deltaSOC_bytcc_Mgha.csv | Yes | Per-catchment change in soil organic carbon (ΔSOCc, Mg/ha) by tree-cover class. Used to recalculate soil carbon when tree-cover proportions change. |
herb_traits_ready.csv | Yes | Per-species herbivore trait table. Used to recalculate herbivore-related indicators (dry matter intake, methane emissions, diet-based biomass) when species counts or total herbivore biomass targets change. |
NPP_by_treecover.csv Format
One row per catchment. Indexed by catchID (matches HYBAS_ID). Ten value columns correspond to tree-cover class bins from lowest to highest woody cover:
| Column | Tree-cover class |
|---|---|
X0_5 | 0–5% |
X05_10 | 5–10% |
X10_20 | 10–20% |
X20_30 | 20–30% |
X30_40 | 30–40% |
X40_50 | 40–50% |
X50_60 | 50–60% |
X60_70 | 60–70% |
X70_80 | 70–80% |
X80_100 | 80–100% |
catchID,X0_5,X05_10,X10_20,X20_30,X30_40,X40_50,X50_60,X60_70,X70_80,X80_100
1121879850,180.2,195.4,210.1,225.8,238.0,248.5,257.2,262.0,265.1,268.4
At runtime the application area-weights these values across all catchments in a site to produce a single SiteNPPByTC[10] vector used by the recalculation engine.
deltaSOC_bytcc_Mgha.csv Format
Identical structure to NPP_by_treecover.csv — one row per catchment, the same ten tree-cover class columns (X0_5 through X80_100), indexed by catchID. Values represent the change in soil organic carbon (Mg/ha) expected at each tree-cover level relative to a baseline. Negative values indicate carbon loss; positive values indicate gain.
catchID,X0_5,X05_10,X10_20,X20_30,X30_40,X40_50,X50_60,X60_70,X70_80,X80_100
1121879850,-0.86,-0.64,-0.33,0.27,0.76,1.57,2.52,3.61,4.84,6.21
herb_traits_ready.csv Format
One row per herbivore species. Indexed by Common_name, which must match the species names used as suffixes in the herbs_sp_counts_* and herbs_sp_kgkm2_* indicator columns in the scenario CSVs.
| Column | Type | Description |
|---|---|---|
Species | text | Short species code (e.g. Aep_mela) |
Latin_binomial | text | Scientific name (e.g. Aepyceros melampus) |
Common_name | text | Common name used as the lookup key (e.g. Impala) |
Body_mass | float | Body mass in kg per individual |
Diet | text | Diet category; must match the suffix used in herbs_diet_* indicator columns (e.g. Browser-grazer intermediate) |
Herd | text | Social grouping (informational) |
Water | text | Water dependency (informational) |
Gut_type | text | Digestive system type (informational) |
Habitat | text | Preferred habitat type (informational) |
HFT_Hempson_2015 | text | Hempson 2015 functional type classification (informational) |
HFT_BII | text | BII functional type; must match the suffix used in herbs_fg_* indicator columns |
Prop_Grass | float | Fraction of diet that is grass (0–1) |
DMI_kg_indiv_yr | float | Dry matter intake in kg per individual per year |
CH4_kg_indiv_yr | float | Methane emission in kg CH4 per individual per year |
Species,Latin_binomial,Common_name,Body_mass,Diet,Herd,Water,Gut_type,Habitat,HFT_Hempson_2015,HFT_BII,Prop_Grass,DMI_kg_indiv_yr,CH4_kg_indiv_yr
Aep_mela,Aepyceros melampus,Impala,49.1,Browser-grazer intermediate,Gregarious,High,Ruminant,Open,Water-dependent grazer,Mixed feeder,0.5,1186.5,21.3
Building the Datapack
# Place all input files in data/ then run:
dt geopackage

# Or directly:
./scripts/build-geopackage.sh ./data
The build script produces data/datapack.gpkg by:
- Copying
catchments.gpkgas the base output file. - Importing each scenario CSV as a raw table via
ogr2ogr. - Converting all data columns to
REALtype (replacesNAwithNULL). - Normalising column names (dashes, spaces, apostrophes → dots;
catchID→catchment_id). - Creating an integer
catchment_id_intindex column on each scenario table for fast joins. - Pre-computing a
geojsontext column on thecatchments_lev12table to avoid geometry conversion at query time. - Computing
domain_minimaanddomain_maximatables — one row each, with the global min/max for every attribute across both scenarios.
To package the final distributable archive:
GeoPackage Schema (datapack.gpkg)
datapack.gpkg is a standard GeoPackage (SQLite with spatial extensions). The application opens it read-only at startup.
| Table | Description |
|---|---|
catchments_lev12 | Catchment polygon geometries. Columns: HYBAS_ID (text), geom (binary WKB), geojson (precomputed text). |
scenario_current | Current scenario metrics. Columns: catchment_id (text), catchment_id_int (integer index), plus one REAL column per indicator. |
scenario_reference | Reference scenario metrics. Same structure as scenario_current. |
scenario_current_lower | Current scenario lower uncertainty bounds. Same structure. |
scenario_current_upper | Current scenario upper uncertainty bounds. Same structure. |
scenario_reference_lower | Reference scenario lower uncertainty bounds. Same structure. |
scenario_reference_upper | Reference scenario upper uncertainty bounds. Same structure. |
domain_minima | One row, one column per indicator — the global minimum across both scenarios. Used to set the colour-scale lower bound consistently when comparing scenarios. |
domain_maxima | One row, one column per indicator — the global maximum. |
metadata | (Optional) Imported directly from metadata.csv. Mirrors the CSV structure. |
Map Tiles (africa.mbtiles)
A MapLibre-compatible MBTiles archive containing pre-rendered vector tiles for the base map. The application serves tiles from this file via a local tile server.
See Data Preparation for instructions on building this file from source GeoPackage layers.
Map Style (style.json)
A MapLibre GL Style Specification JSON file that controls how every layer in the map tiles is rendered — colours, line widths, label fonts, zoom-level visibility, etc.
Manifest (manifest.json)
Declares what the pack holds, when it was built, and the state of the data directory at the time. Written by decision-theatre pack-data (reached through dt pack-data or scripts/pack-data.sh), both inside the archive and alongside it as <pack>.zip.manifest.json — so a download page can describe a pack without fetching gigabytes.
{
  "format": "decision-theatre-datapack",
  "version": "1.0.0",
  "description": "Decision Theatre Data Pack — catchment scenario data and map tiles",
  "created": "2026-08-16T20:12:29Z",
  "built_by": "decision-theatre pack-data 1.0.0",
  "source_dir": "/home/user/DecisionTheatre/data",
  "check": {
    "ok": true,
    "errors": 0,
    "warnings": 2
  },
  "total_size_bytes": 14446721024,
  "file_count": 12,
  "files": [
    {
      "path": "datapack.gpkg",
      "size_bytes": 3453300736,
      "sha256": "686eef0abb60158de4d7e64a347ea6f5f3653c0b488c9a5782a50b264c2315aa"
    }
  ],
  "excluded": [
    {
      "path": "current.csv",
      "role": "build input",
      "reason": "input to scripts/build-geopackage.sh; not read at runtime",
      "size_bytes": 242611712
    }
  ]
}
| Field | Meaning |
|---|---|
created | Packaging timestamp, UTC, RFC 3339 |
built_by | The tool and version that produced the pack |
check | The checker's verdict when the pack was built. forced: true appears if it was built despite errors |
files | Every packed file with its size and SHA-256, so an installation can be verified without unpacking |
excluded | What was deliberately left out and why, so a missing 250 MB CSV is never mistaken for an accident |
A checksum for the archive itself is written to <pack>.zip.sha256 in the format sha256sum -c expects.
Older packs
Packs built before this format carried only format, version, description and created. The installer reads exactly those four fields and ignores the rest, so old and new packs both install.
metadata.csv Column Reference
metadata.csv is an optional but strongly recommended file. The application reads it once at startup and caches every column into memory. Each row describes one indicator column. The ColumnName column is the primary key and must match the column name used in the scenario CSVs exactly.
Column Descriptions
ColumnName (required)
The exact column name as it appears in the scenario CSVs (current.csv, reference.csv, etc.). This is the primary key that links every other metadata field to a specific indicator. All other columns are optional; a row with only ColumnName set is valid.
Example: lowTC_prop, AGBwd_Mgha, NPP_gm2
Detailed name
A human-readable label for the indicator. Shown in the factor selector dropdown in the control panel and as the label on chart axes. Also used as the fallback value for x axis when that field is empty or "all".
Aliases accepted: Detailed_name
Example: Proportion open ecosystem, Above-ground woody biomass, Net primary productivity
Description
A longer plain-text explanation of what the indicator measures. Currently stored in the metadata cache but not displayed directly in the UI — reserved for future tooltip or help text functionality.
Example: Proportion of the catchment that is open/grassy
VariableType_highest level of grouping
The top-level category used to group indicators in the control panel's factor selector. Indicators with the same variable type are shown together under a collapsible group header.
Aliases accepted: VariableType
Example: Biomass_Summary, Fire, Herbivores, Soil
Summaryvalue
A secondary grouping hint. Currently stored in the metadata cache. Not actively displayed in the UI but available for future grouping or filtering features.
Example: total, catchID
axis label
The label shown on the Y-axis of line charts and dial charts for this indicator. Typically a concise version of the unit or metric name.
Aliases accepted: axis_label
Example: tree cover fraction, Woody AGB (Mg/ha), Soil Organic Carbon
Units
The physical unit of measurement. Displayed alongside the value in chart tooltips, axis labels, and the indicator detail panel.
Example: proportion, Mgha-1, gm-2, kgkm-2, percentage
Grouping variable
Maps this column to a named line-chart group. Columns that share the same Grouping variable value are plotted together on a single chart as separate lines — for example, all herbivore species diet types on one chart, or all biomass class proportions on one chart.
When a column is part of a group, its axis label becomes the X-axis tick label and the group name becomes the chart title.
Example: lowTC (groups all open-ecosystem proportion classes), Diet (groups herbivore diet breakdown columns), Season (groups fire season columns)
x axis
The X-axis tick label for this column when it belongs to a grouped line chart. If empty or set to "all", the value from Detailed name is used instead.
Aliases accepted: x_axis, x-axis
Example: 0–5, 5–10, Early, Late, Browser, Grazer
MapthisYN
Controls whether this indicator appears in the choropleth map (the coloured catchment overlay). Set to 1 to allow map display; 0 to hide it from the map layer selector. Indicators with complex multi-column semantics (e.g. species breakdowns) are typically excluded from the map.
Accepted values: 1 / true = visible on map, 0 / false = hidden
Aliases accepted: canMap
Example: 1 for lowTC_prop, 0 for a species count column
graphthisYN
Controls whether this indicator appears in the charts panel. Set to 1 to include it in the chart selector; 0 to exclude it. Indicators that are only meaningful as inputs or as part of a composite metric may be excluded from charting.
Accepted values: 1 / true = visible in charts, 0 / false = hidden
Aliases accepted: canGraph
typeofgraph
Specifies which chart type is used when this indicator is selected in the charts panel.
Aliases accepted: chartType
| Value | Chart rendered |
|---|---|
dial/boxplot | Dial chart (reference vs. current vs. target needle) with a whisker-plot inset |
boxplot | Whisker plot only, no dial |
line | Grouped line chart (requires Grouping variable to be set) |
Example: dial/boxplot for summary indicators, line for species or proportion-class breakdowns
In_dropdownlistYN
A flag indicating whether this column should appear in dropdown selectors in the UI. Stored in the metadata cache for future use; not currently queried by any active handler.
Accepted values: 1 / true, 0 / false
CurrentInputsAllowed
Whether the user can manually edit this indicator's value in the current scenario via the indicator editor. Set to 1 for indicators that represent controllable management inputs (e.g. tree cover targets). The editor shows a slider bounded by Target_min / Target_max.
Setting this to 1 does not trigger automated recalculation of dependent indicators; TargetInputsAllowed controls that behaviour.
Accepted values: 1 / true = editable, 0 / false = read-only
Aliases accepted (legacy): userInput
TargetInputsAllowed
Whether changes to this indicator trigger the cascading ecological recalculation workflow. This is a stronger form of editability: when the user adjusts a column marked TargetInputsAllowed = 1, the application automatically recalculates all dependent indicators (e.g. adjusting tree cover proportion recalculates above-ground biomass, soil carbon, fire metrics, and herbivore carrying capacity).
Only a small set of key driver indicators should have this flag set. The recalculation logic is defined in internal/api/recalculate.go.
Accepted values: 1 / true = triggers recalculation, 0 / false = no cascade
Aliases accepted (legacy): targetInput
Target_min
The minimum allowed value when the user adjusts this indicator via the target slider in the indicator editor. If omitted, no lower bound is enforced (slider defaults to the observed domain minimum).
Type: floating-point number
Example: 0 for a proportion, 0 for a count
Target_max
The maximum allowed value for the target slider. If omitted, no upper bound is enforced (slider defaults to the observed domain maximum).
Type: floating-point number
Example: 1 for a proportion, 100 for a percentage
updatable
A flag indicating whether this indicator's value can be automatically recomputed when dependencies change. Stored in the metadata cache; not currently queried by an active handler — reserved for future use in selective recalculation pipelines.
Accepted values: 1 / true, 0 / false
MappreferredColour
The hex colour used for the choropleth colour scale for this indicator on the map. The application applies a PRISM colour ramp anchored to this colour. Common typos in hex digits are corrected automatically (e.g. O → 0).
Aliases accepted: color
Example: #ESCF3D, #0B6623, #743089
Note
If this column is empty or the colour is invalid, the map falls back to a default colour scale for that indicator.
Boolean Parsing
All boolean columns (MapthisYN, graphthisYN, CurrentInputsAllowed, TargetInputsAllowed, In_dropdownlistYN, updatable) accept:
1ortrue(case-insensitive) → true- Any other value (including
0, empty string,false) → false
Column Name Fallbacks
The application searches for column names using the preferred name first, then falls back to legacy aliases:
| Preferred name | Legacy fallback |
|---|---|
MappreferredColour | color |
Detailed name | Detailed_name |
VariableType_highest level of grouping | VariableType |
CurrentInputsAllowed | userInput |
TargetInputsAllowed | targetInput |
MapthisYN | canMap |
graphthisYN | canGraph |
axis label | axis_label |
x axis | x_axis, then x-axis |
typeofgraph | chartType |
This means you can use either naming convention — the preferred names match the actual column headers in the example metadata.csv, while the legacy names were used in earlier datasets.
Minimal metadata.csv Example
The following excerpt shows two complete rows — one for a summary indicator and one for a species breakdown line-chart column:
ColumnName,Detailed name,Description,VariableType_highest level of grouping,Summaryvalue,axis label,Units,Grouping variable,x axis,MapthisYN,graphthisYN,typeofgraph,In_dropdownlistYN,CurrentInputsAllowed,TargetInputsAllowed,Target_min,Target_max,updatable,MappreferredColour
lowTC_prop,Proportion open ecosystem,Proportion of the catchment that is open/grassy,Biomass_Summary,total,tree cover fraction,proportion,lowTC,,1,1,dial/boxplot,1,1,1,0,1,1,#ESCF3D
herbs_diet_kgkm2_Browser,Browser herbivore biomass,Biomass of browsing herbivore species,Herbivores,diet,Biomass (kg/km²),kgkm-2,Diet,Browser,0,1,line,0,0,0,,,0,
In the second row the indicator appears only in charts (not on the map), uses a line chart grouped under Diet, and does not allow user editing.