User Guide
A guided path from installing the application to setting your own targets. Each step is short, self-contained, and ends with a link to the next one.
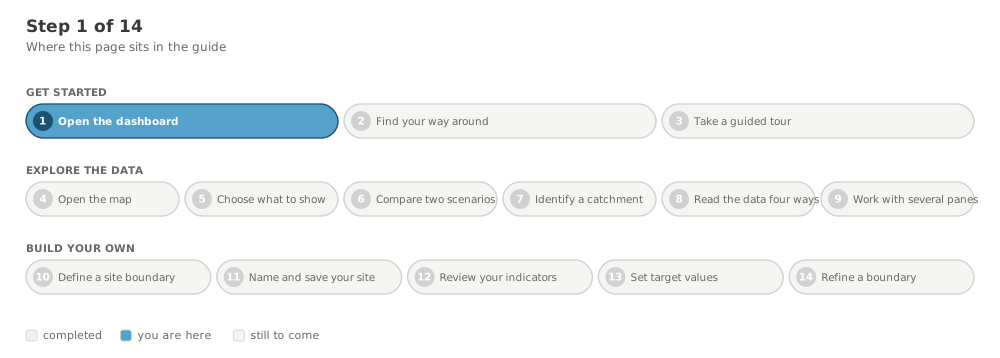
The steps
Get started
- Open the dashboard — Get to Decision Theatre in your browser. Nothing to install.
- Find your way around — Recognise the landing page and know the ways in.
- Take a guided tour — See the application fully populated before building anything yourself.
Explore the data
- Open the map — Get to the map workspace and learn its controls.
- Choose what to show — Select a factor, two scenarios, and the area to summarise over.
- Compare two scenarios — Use the swipe divider to read one scenario against another.
- Identify a catchment — Inspect the numbers behind a single catchment.
- Read the data four ways — Switch a pane between map, chart, dial and table.
- Work with several panes — Use grid view to watch several factors at once.
Build your own
- Define a site boundary — Mark out the study area you actually care about.
- Name and save your site — Turn the boundary into a saved site you can return to.
- Review your indicators — Read the indicator values computed for your site.
- Set target values — Say what you are aiming for, and see what it implies.
- Refine a boundary — Adjust a site's shape after the fact.