Step 4 — Open the map
Goal
Get to the map workspace and learn its controls.
Background
The map is the core workspace. Everything else — charts, dials, tables — is a different lens on the same selection you make here.
You can reach it either by opening a site, or through Explore mode with no site at all.
Steps
- Either open a site from My Sites, or click Explore the Future of Ecosystem Decision-Making on the landing page.
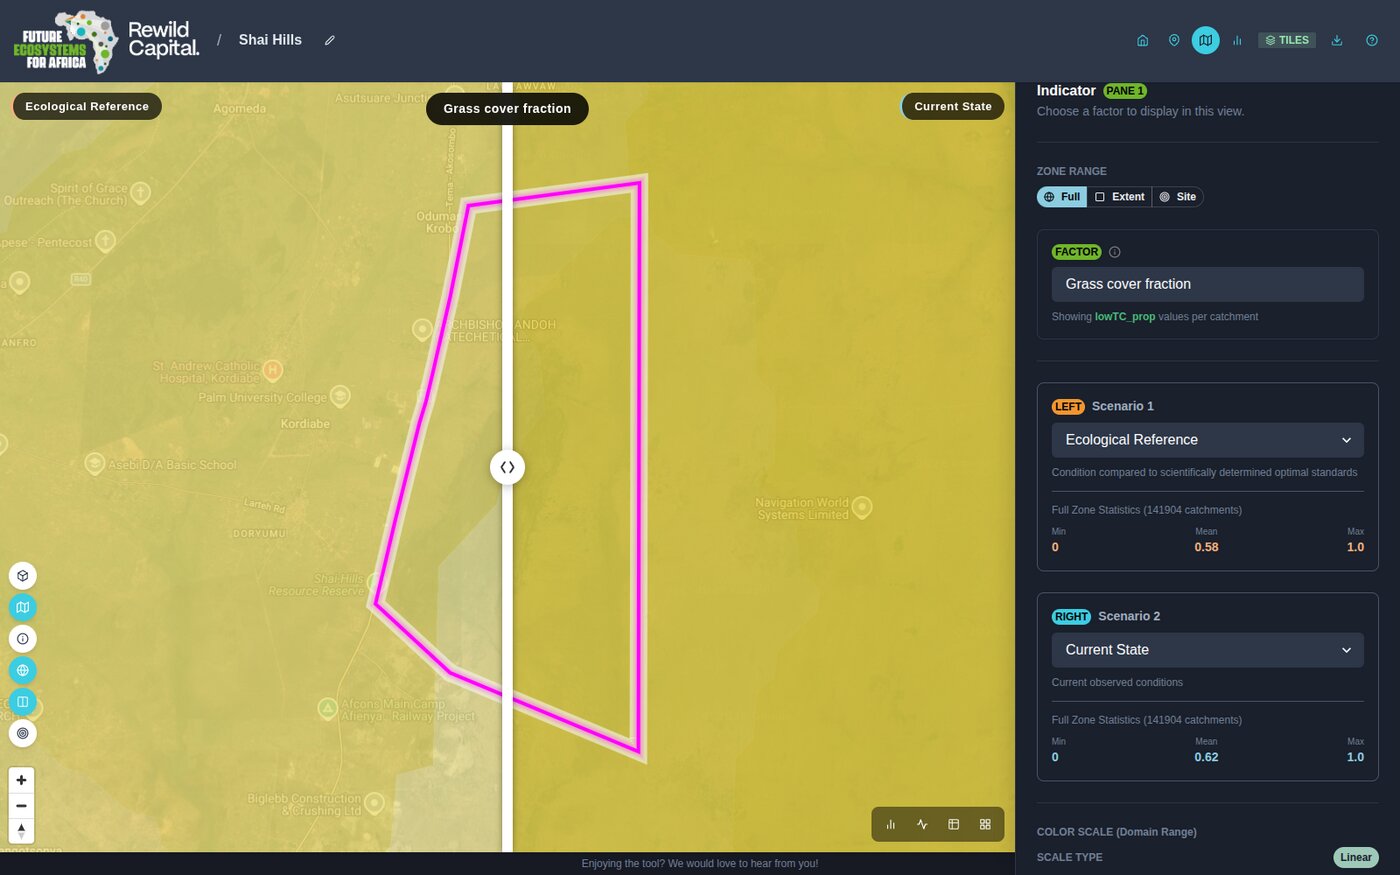
- You arrive in single-pane view with the indicator panel open on the right.
Map controls
Each map pane carries its own floating toolbar:
| Control | What it does |
|---|---|
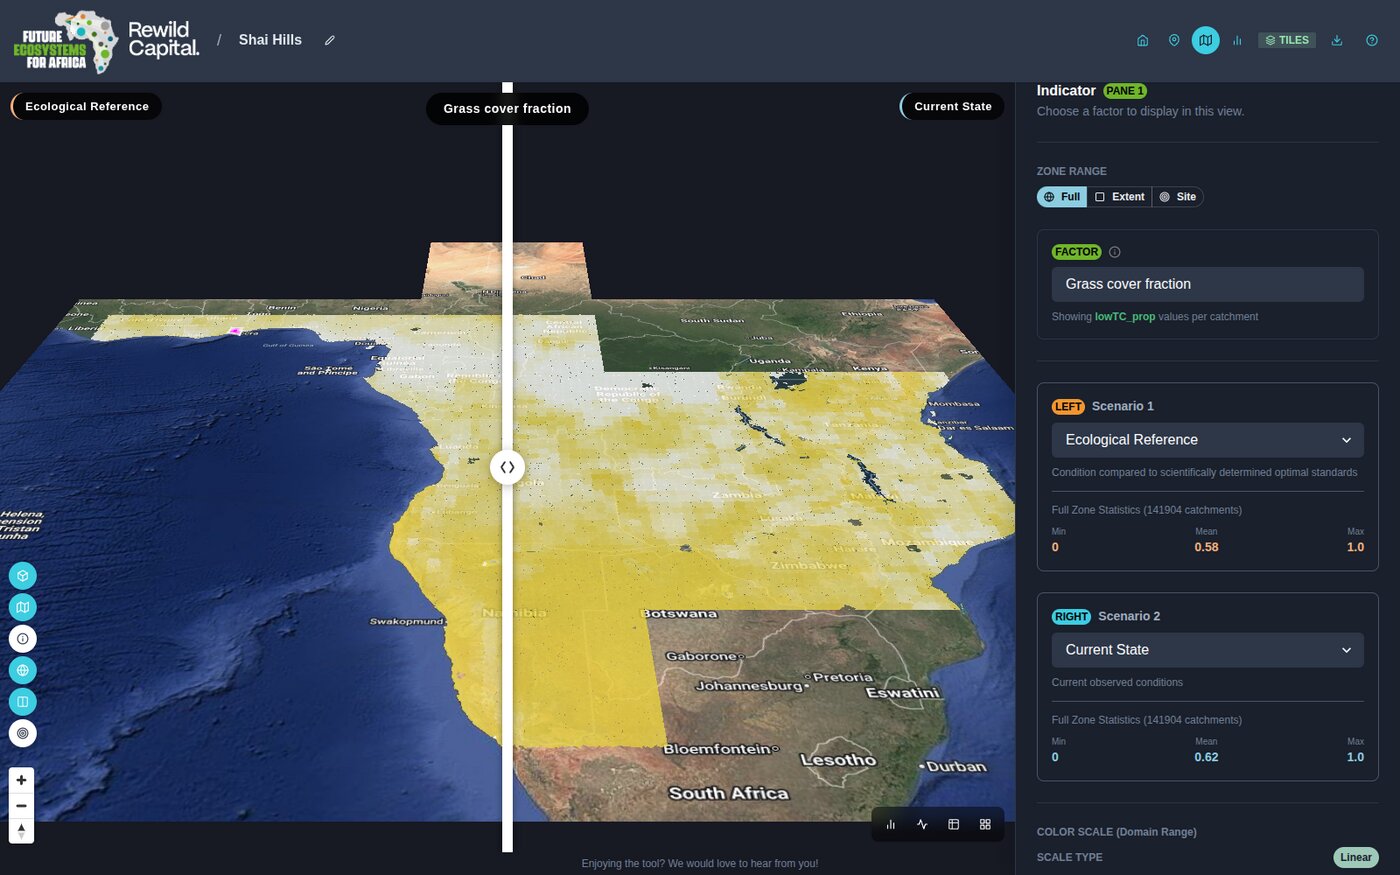
| Toggle 3D view (cube) | Tilts to a 60° pitch and extrudes catchments as 3D bars scaled to the chosen factor |
| Toggle choropleth layer (map) | Shows or hides the coloured data overlay |
| Toggle identify mode (info) | Click-to-inspect a catchment — single-pane view only |
| Toggle Google basemap (globe) | Switches between the vector basemap and satellite imagery |
| Toggle map swiper (columns) | Shows or hides the divider between the two compared scenarios |
| Zoom to Site (target) | Fits the map to the site boundary |
Seeing it in three dimensions
The 3D toggle extrudes each catchment to a height proportional to the selected factor, which makes outliers obvious in a way flat colour does not.
What you achieved
- You can reach the map with or without a site
- You know what each map control does
- You have seen the data extruded in 3D