Importing Indicator Data
Once an indicator has been created, data can be imported into GeoSight for visualization and analysis. GeoSight supports multiple import methods, including Excel files, APIs, SharePoint, SDMX, and related tables.
This guide focuses specifically on importing indicator data using the Excel Long Format, which is the most flexible and commonly used approach.
GeoSight uses indicators as centralized data containers, meaning a single indicator can store:
- Multiple dates
- Multiple geographies
- Multiple uploads over time
This structure helps prevent duplicated indicators and keeps data organized across projects and dashboards.
Excel Import Formats
GeoSight supports two Excel-based import structures.
| Format | Description |
|---|---|
| Excel LONG Format | Supports multiple indicators, dates, and geographies within a single spreadsheet. |
| Excel WIDE Format | Supports multiple indicators for a single date only, with indicators stored as columns. |
For this tutorial, we will use the Excel LONG Format.
Recommended Excel LONG Structure
Your Excel file should contain the following required columns:
| Column | Description |
|---|---|
| GeographyCode | Unique geographic code matching the reference dataset boundary codes. |
| IndicatorCode | The indicator shortcode defined in GeoSight. |
| DateTime | Date value for the observation (e.g. 2024-01-01). |
| Value | The numeric or categorical observation value. |
Step 1: Import Data Page
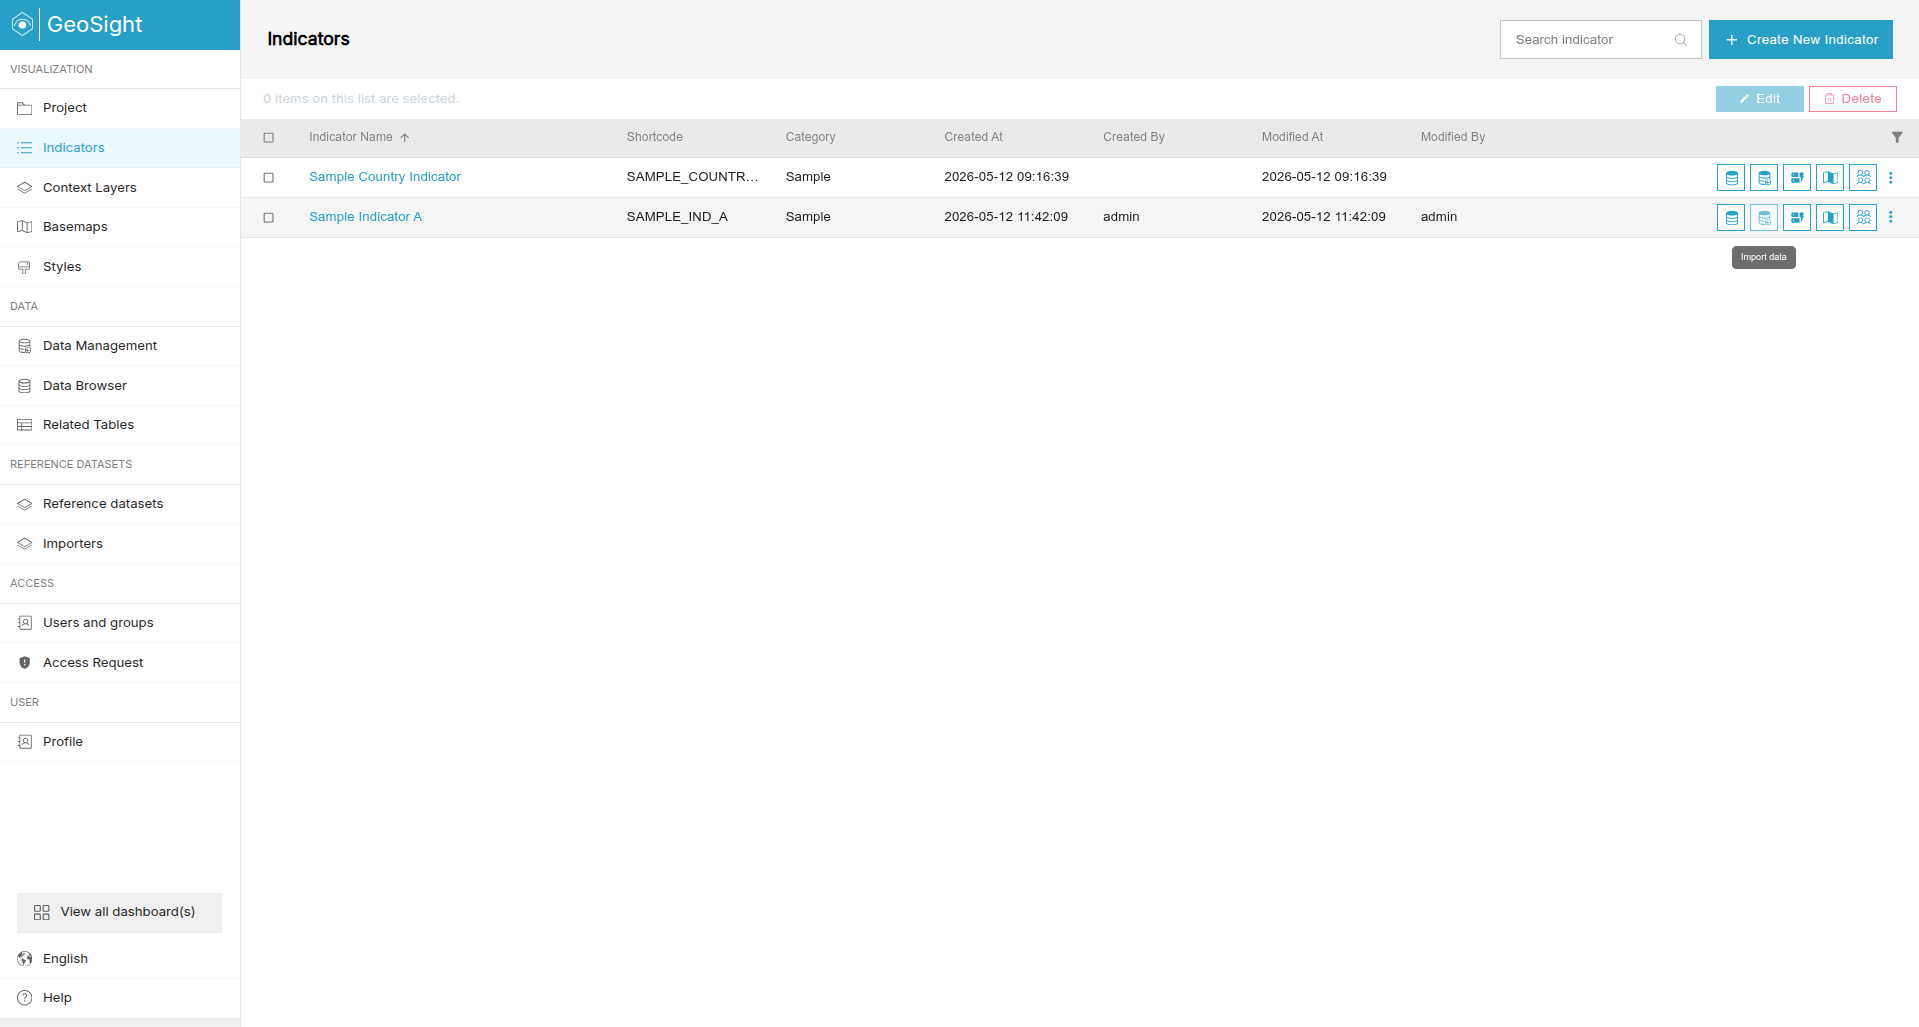
Before importing any data, you first need to open the target indicator and access its data import interface.
-
Navigate to Indicators.
-
Locate your indicator (e.g. Sample Indicator A).
-
Click the Import Data icon.
Step 2: General Settings
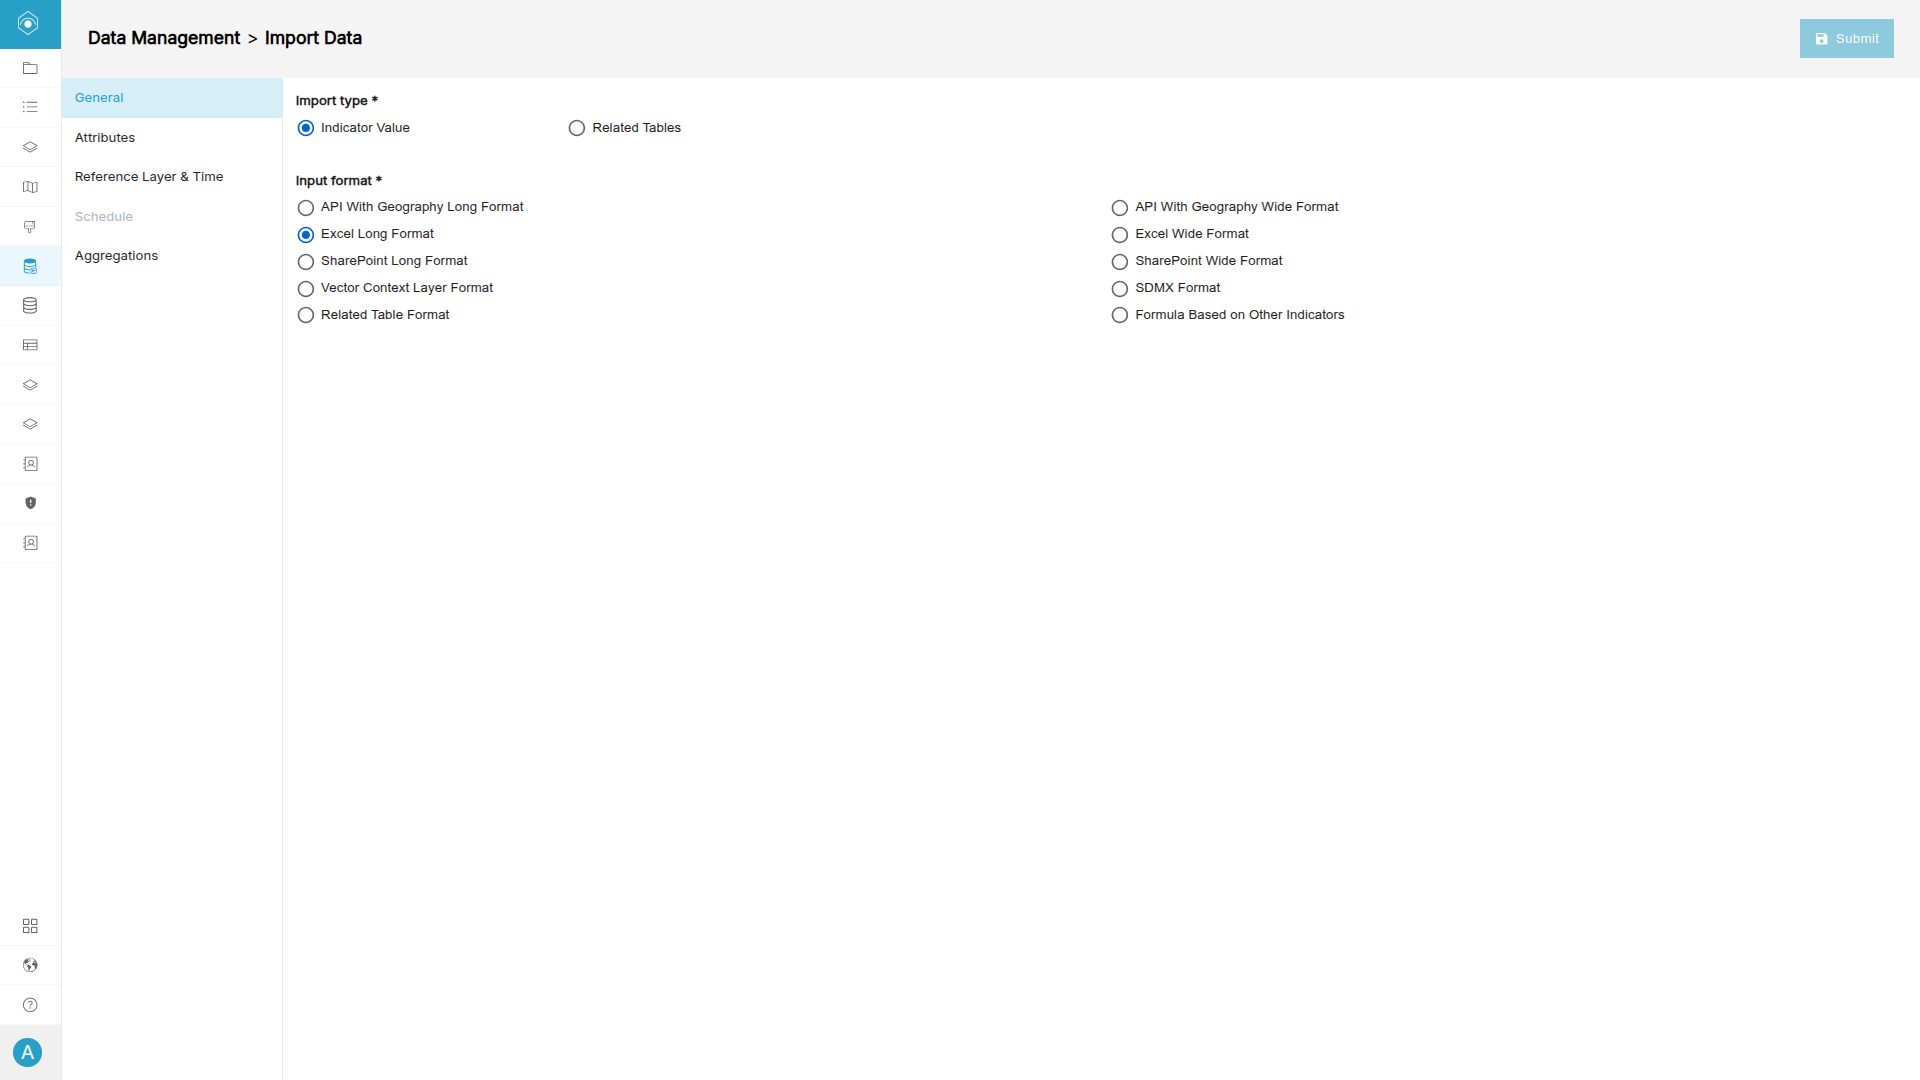
The General tab defines the type and format of the data being imported.
Use the following settings:
| Setting | Value |
|---|---|
| Import Type | Indicator Value |
| Input Format | Excel Long Format |
Step 3: Upload the Excel File
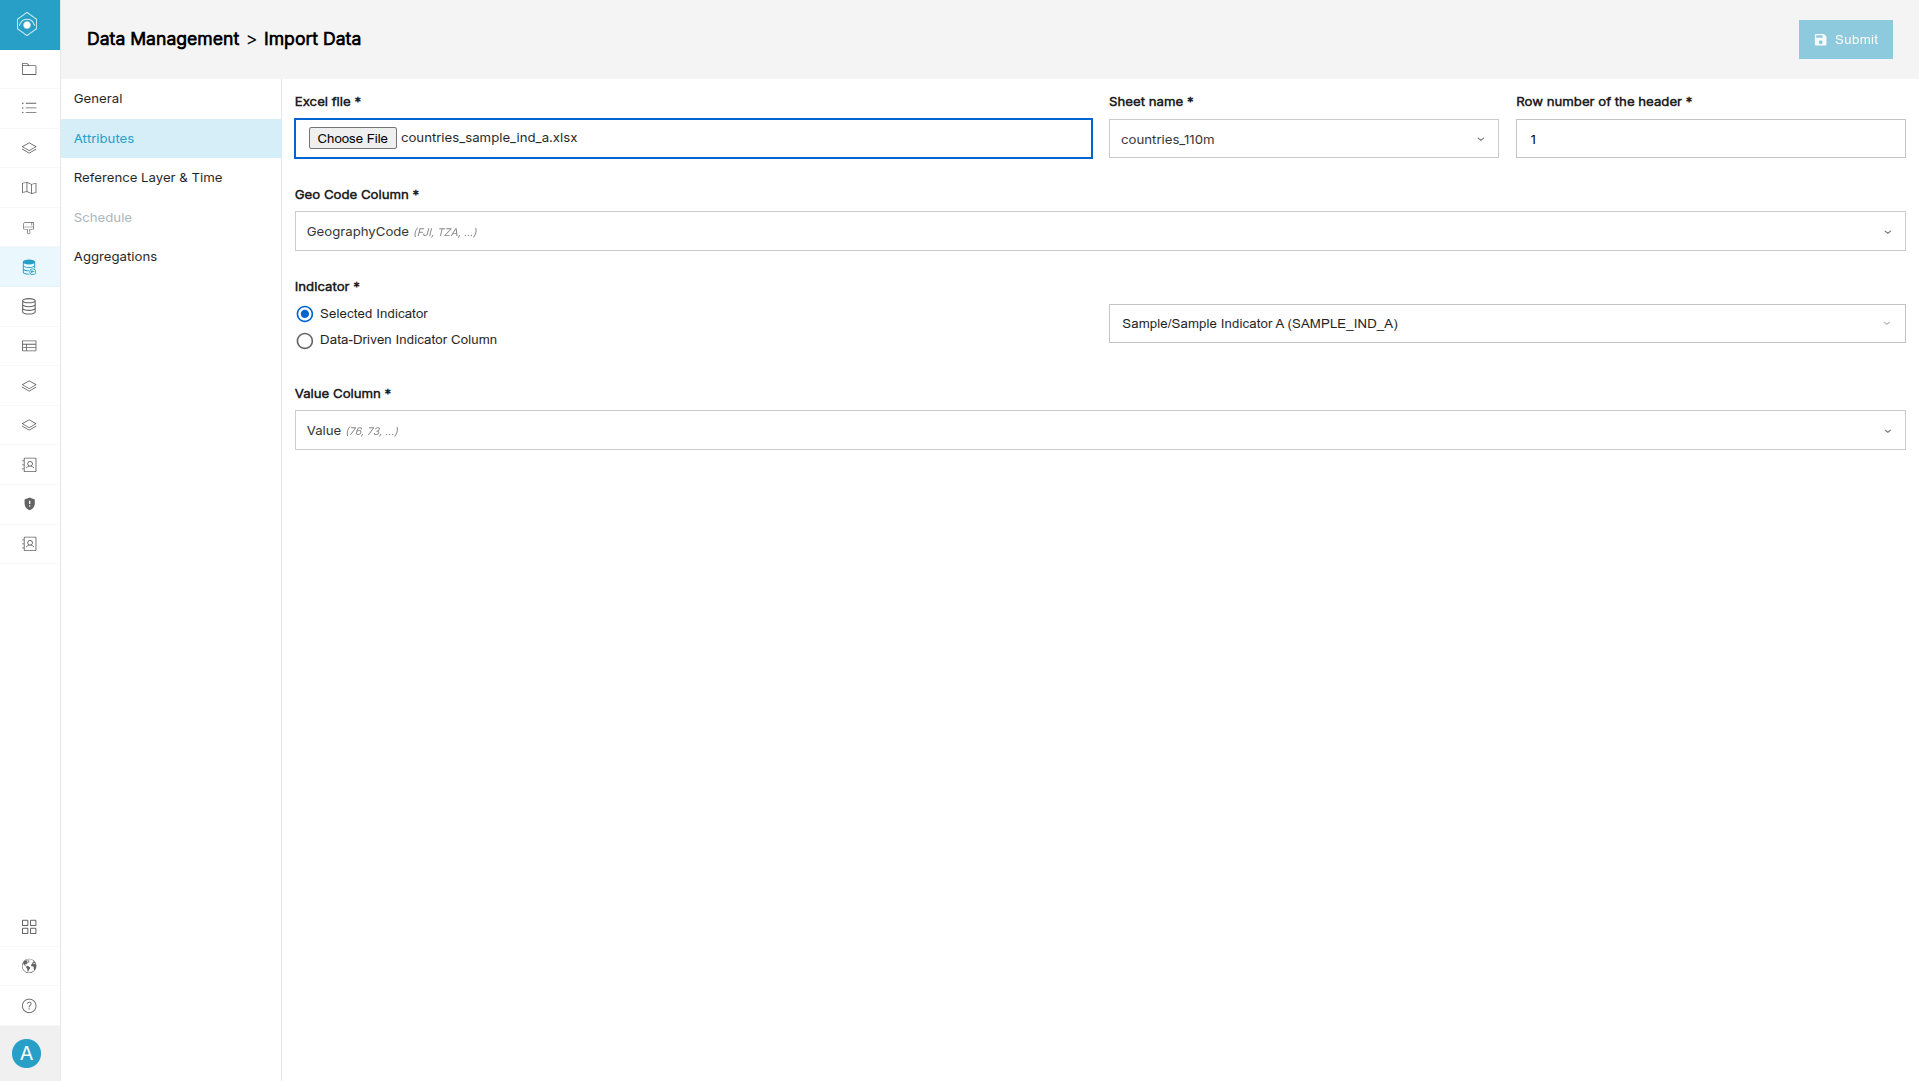
The Attributes tab connects GeoSight to your Excel dataset.
-
Open the Attributes tab.
-
Click Choose File.
-
Select your prepared Excel spreadsheet.
-
Verify that the correct geography and indicator fields are detected.
Step 4: Reference Layer & Time Settings
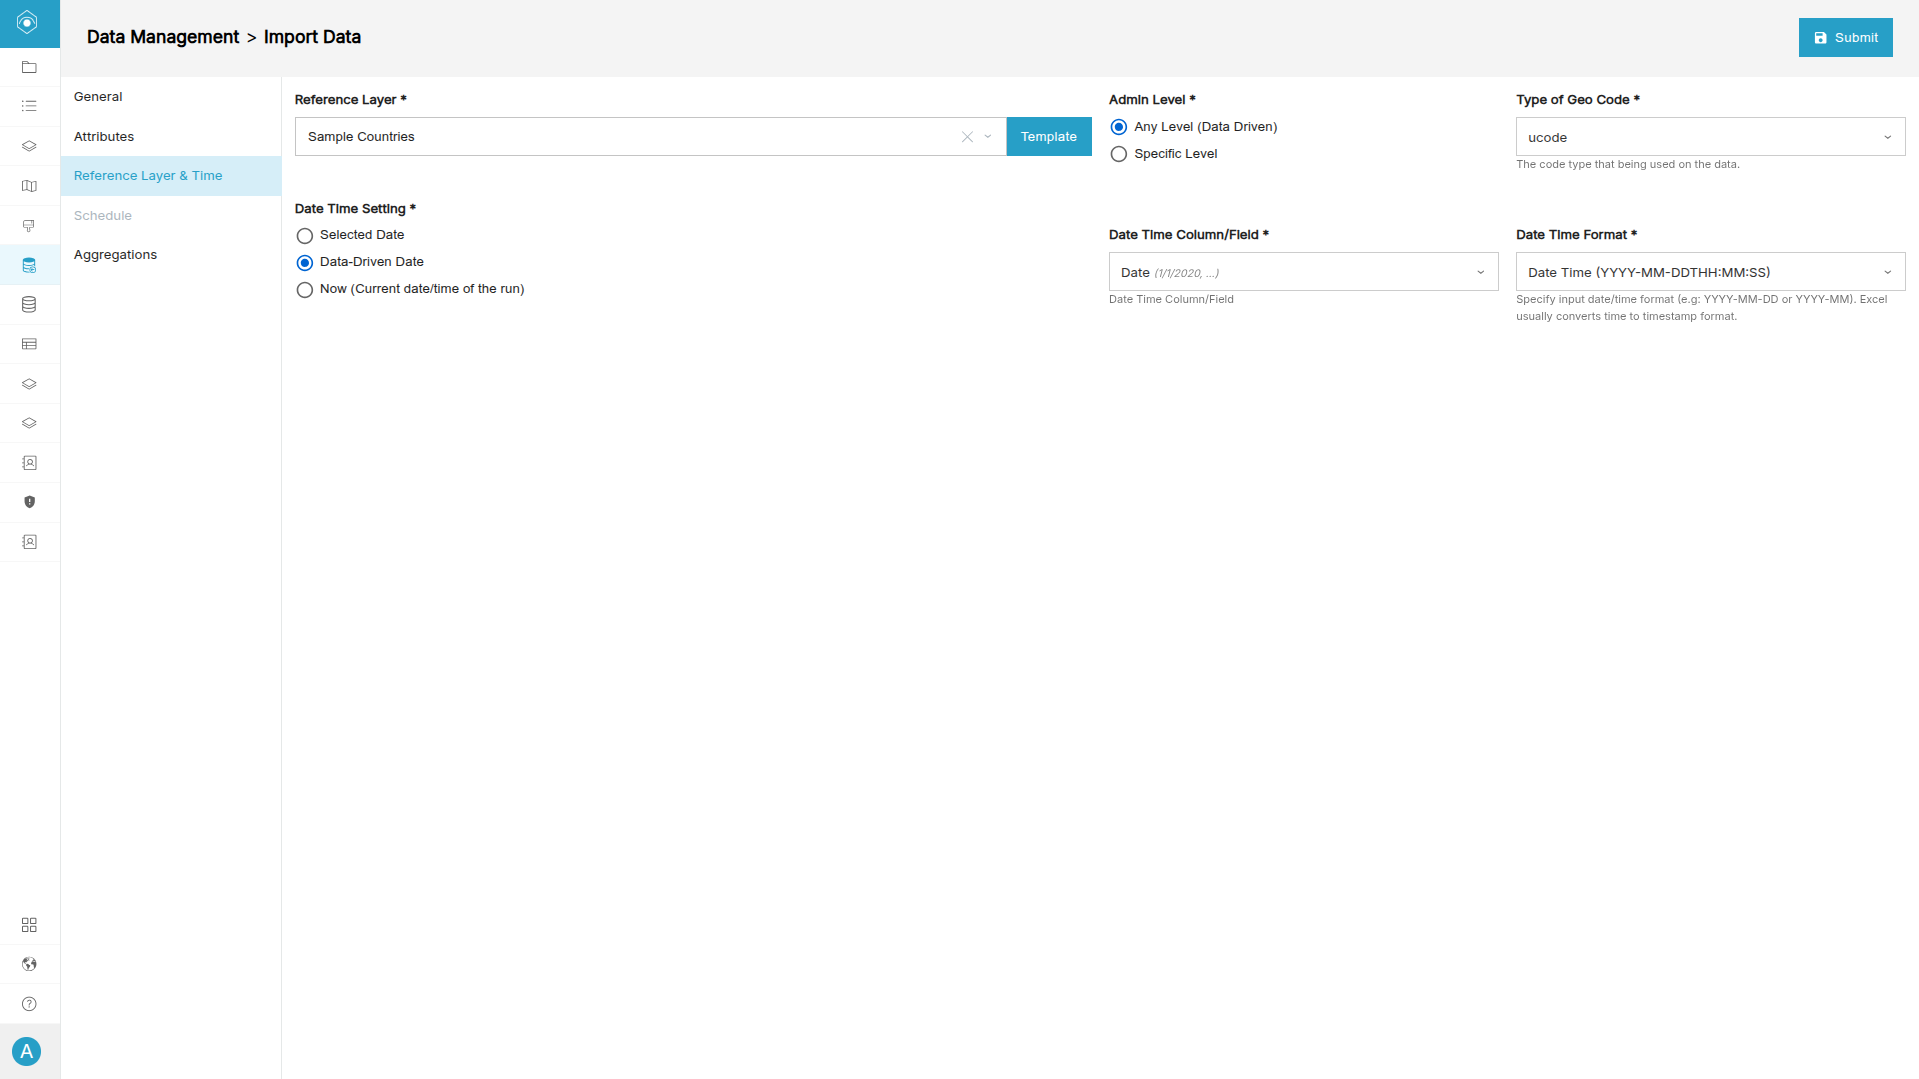
The Reference Layer & Time tab links the uploaded records to your administrative boundaries and time settings.
-
Open the Reference Layer & Time tab.
-
Select your reference dataset from the Reference Layer dropdown.
-
Under Date Time Setting, select Data-Driven Date
-
Choose the correct date field and format
-
Click Submit.
Step 5: Preview Imported Records
After the upload is processed successfully:
-
Click See the data.
-
Review the imported records.
-
Verify that:
- Geography codes linked correctly
- Dates appear correctly
- Values imported successfully
- No records are missing

Step 6: Save Imported Data
The final step is to save the validated records into GeoSight, making the data available for dashboards, maps, and analysis tools.
-
Click Select All Data.
-
Click Save.
-
GeoSight will finalize the import and store the records within the indicator.

Additional Import Sources
Although Excel imports are the most common workflow, GeoSight also supports several other import methods.
| Import Source | Description |
|---|---|
| API | Connect to REST or GeoJSON services for automated imports. |
| SharePoint | Import and synchronize cloud-hosted Excel files. |
| SDMX | Connect to statistical data warehouse services using SDMX standards. |
| Related Tables | Import large disaggregated datasets linked to indicators. |
| Vector Context Layers | Generate indicators from vector spatial datasets. |
Next up: Learn how to create and configure Basemaps in GeoSight to provide background mapping for your dashboards and projects.