Creating Styles
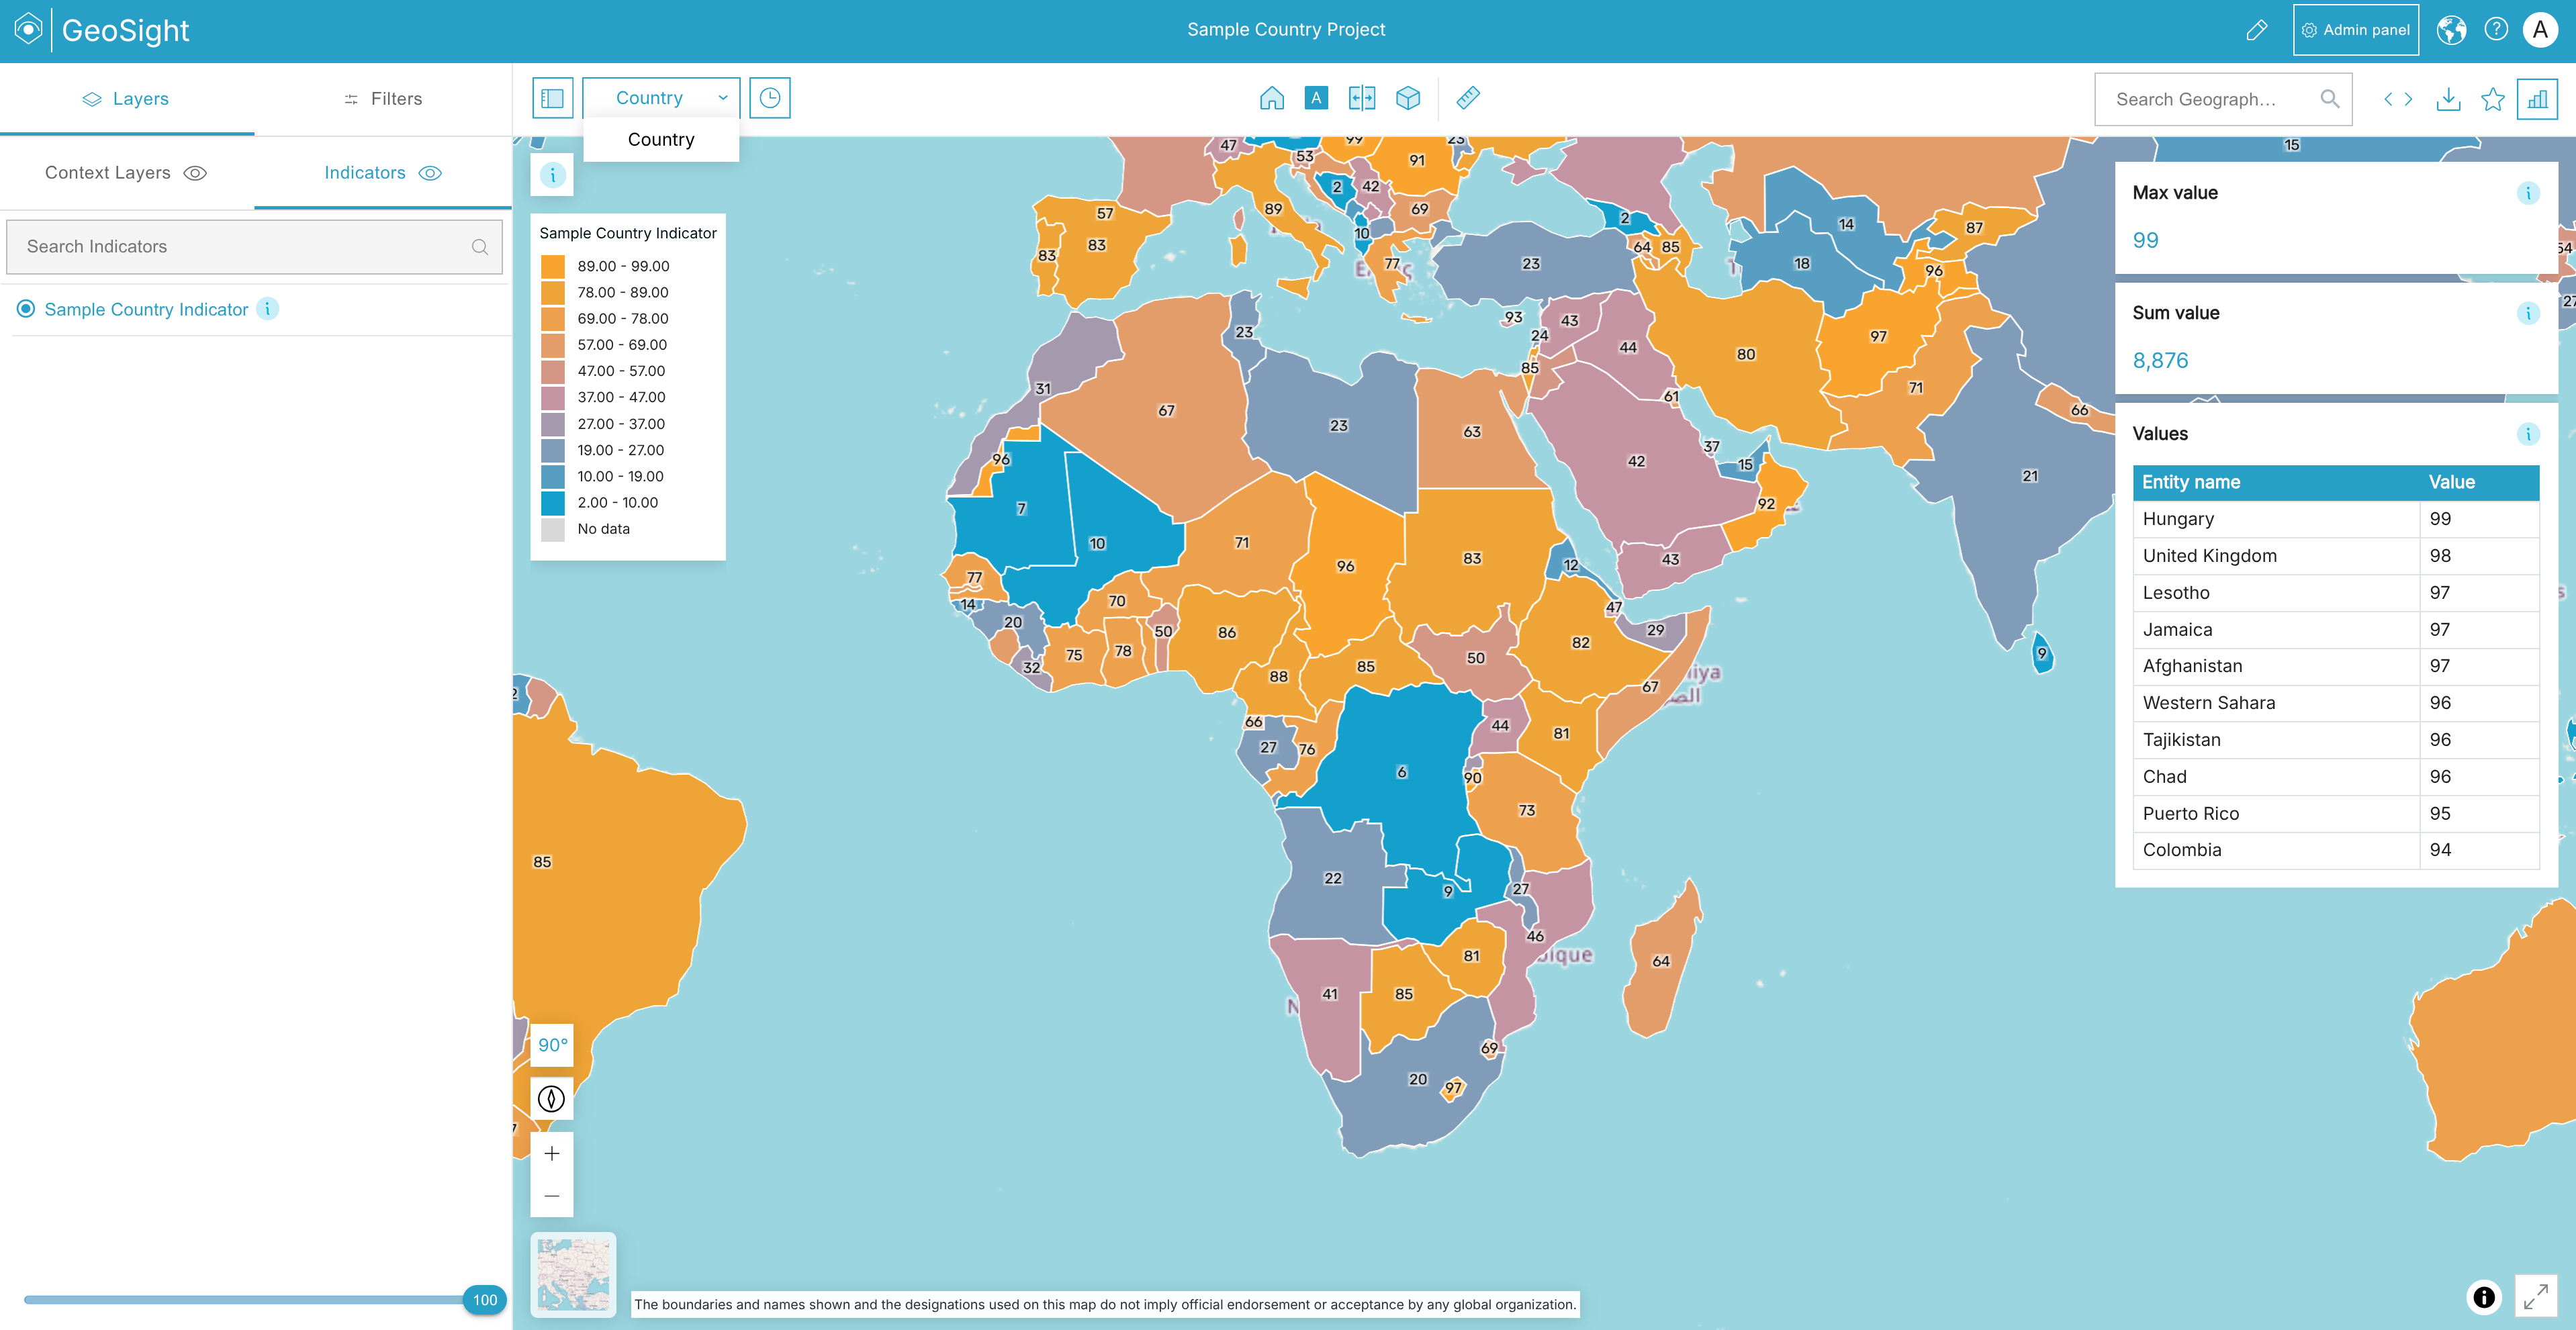
Styles control how indicator data is visualized throughout GeoSight dashboards and maps. They define the colours, classifications, labels, and visual rules used to represent values geographically.
Styles are responsible for transforming data into meaningful visualizations by controlling:
- Colour palettes
- Value classifications
- Category mappings
- No-data handling
- etc.
Styles can be created independently in the Styles library or configured directly inside Indicator Layers within a project.
The Styles page allows users to:
| Function | Description |
|---|---|
| Create Styles | Create reusable map styling templates for indicators and projects. |
| Configure Colour Rules | Define colours, value ranges, categories, and legends. |
| Create Dynamic Styles | Automatically classify data using statistical methods and colour ramps. |
| Edit Styles | Update existing style rules, colours, or classifications. |
| Search & Filter | Search, sort, and filter available styles. |
| Share Access | Control which users or groups can access the style. |
Understanding Style Types
GeoSight supports several different style approaches depending on the type of data being visualized.
| Style Type | Description |
|---|---|
| Predefined Style | Manually configured colour rules and classifications. |
| Dynamic Quantitative | Automatically classifies numeric data using statistical methods. |
| Dynamic Qualitative | Automatically applies colours to category or text-based values. |
Common classification methods for Dynamic Quantitative styles include:
- Jenks Natural Breaks
- Quantile
- Standard Deviation
- Equal Interval
- Geometric Progression
- Arithmetic Progression
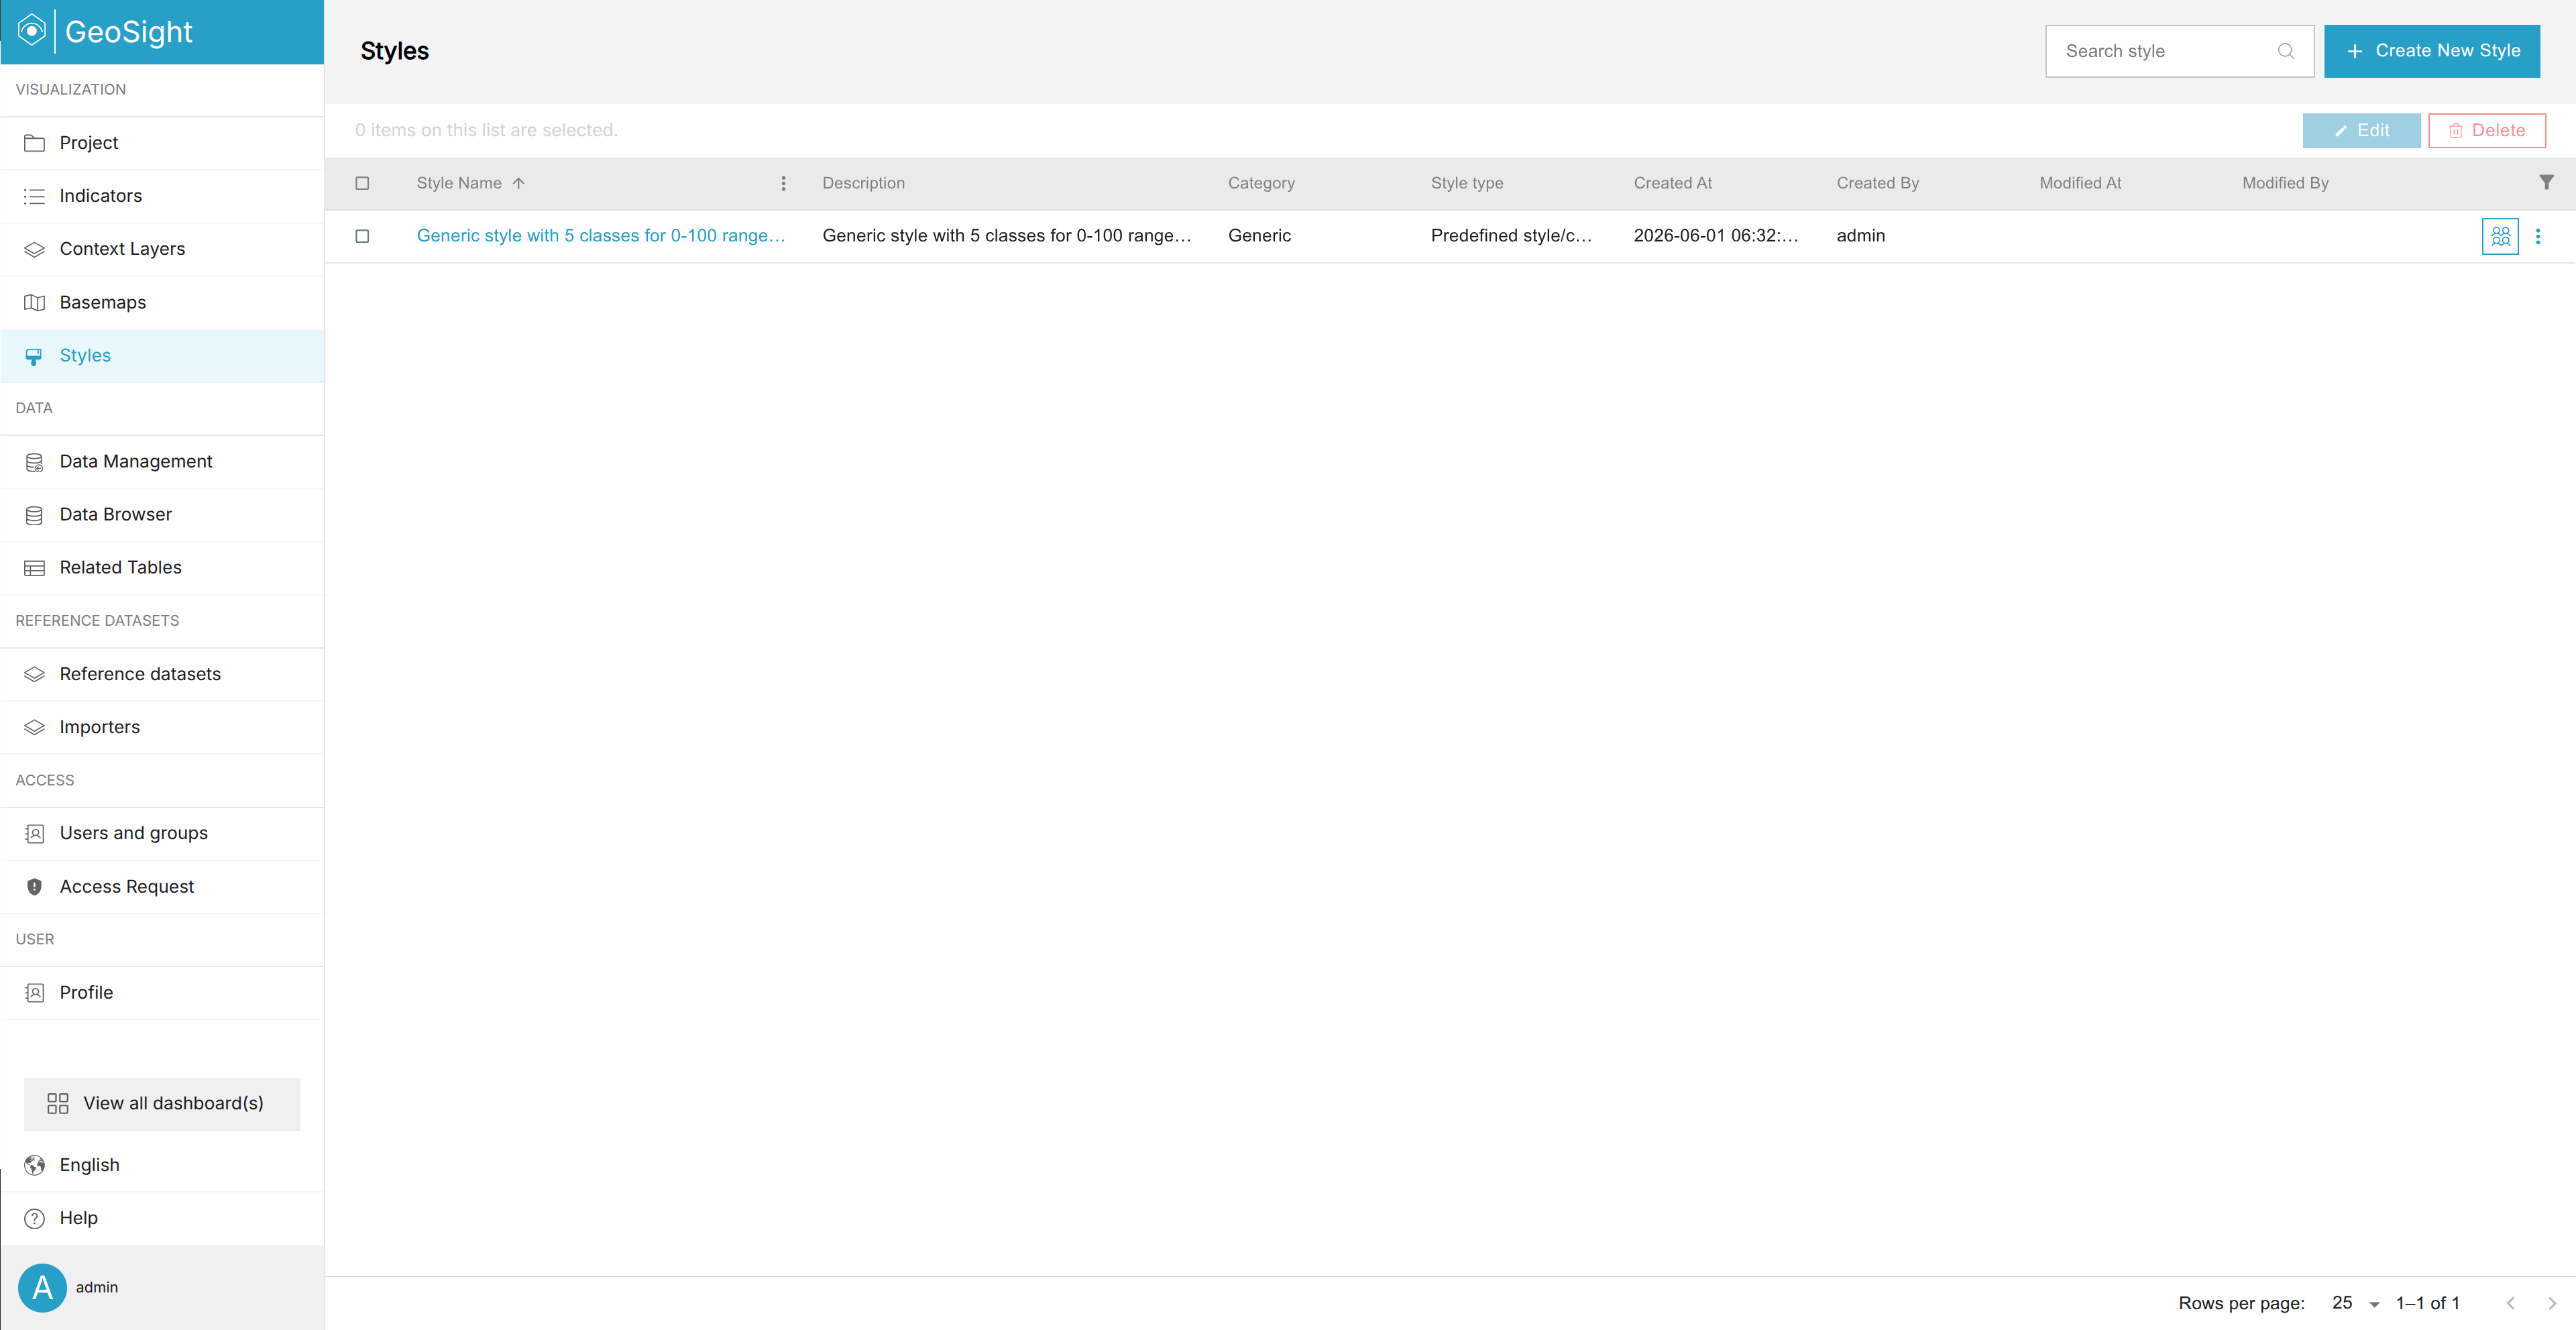
Step 1: Open the Styles Page
The Styles page is used to manage reusable style configurations and colour rules throughout GeoSight.
-
In the left-side navigation panel, click Styles.
-
Use the Search Style field to locate existing styles.
-
Select a style checkbox to enable editing or deletion tools.
Step 2: Create a New Style
Creating a style allows you to define reusable visual rules for indicators and projects.
-
Click Create New Style.
-
Complete the required fields in the General tab.
-
Click Save.
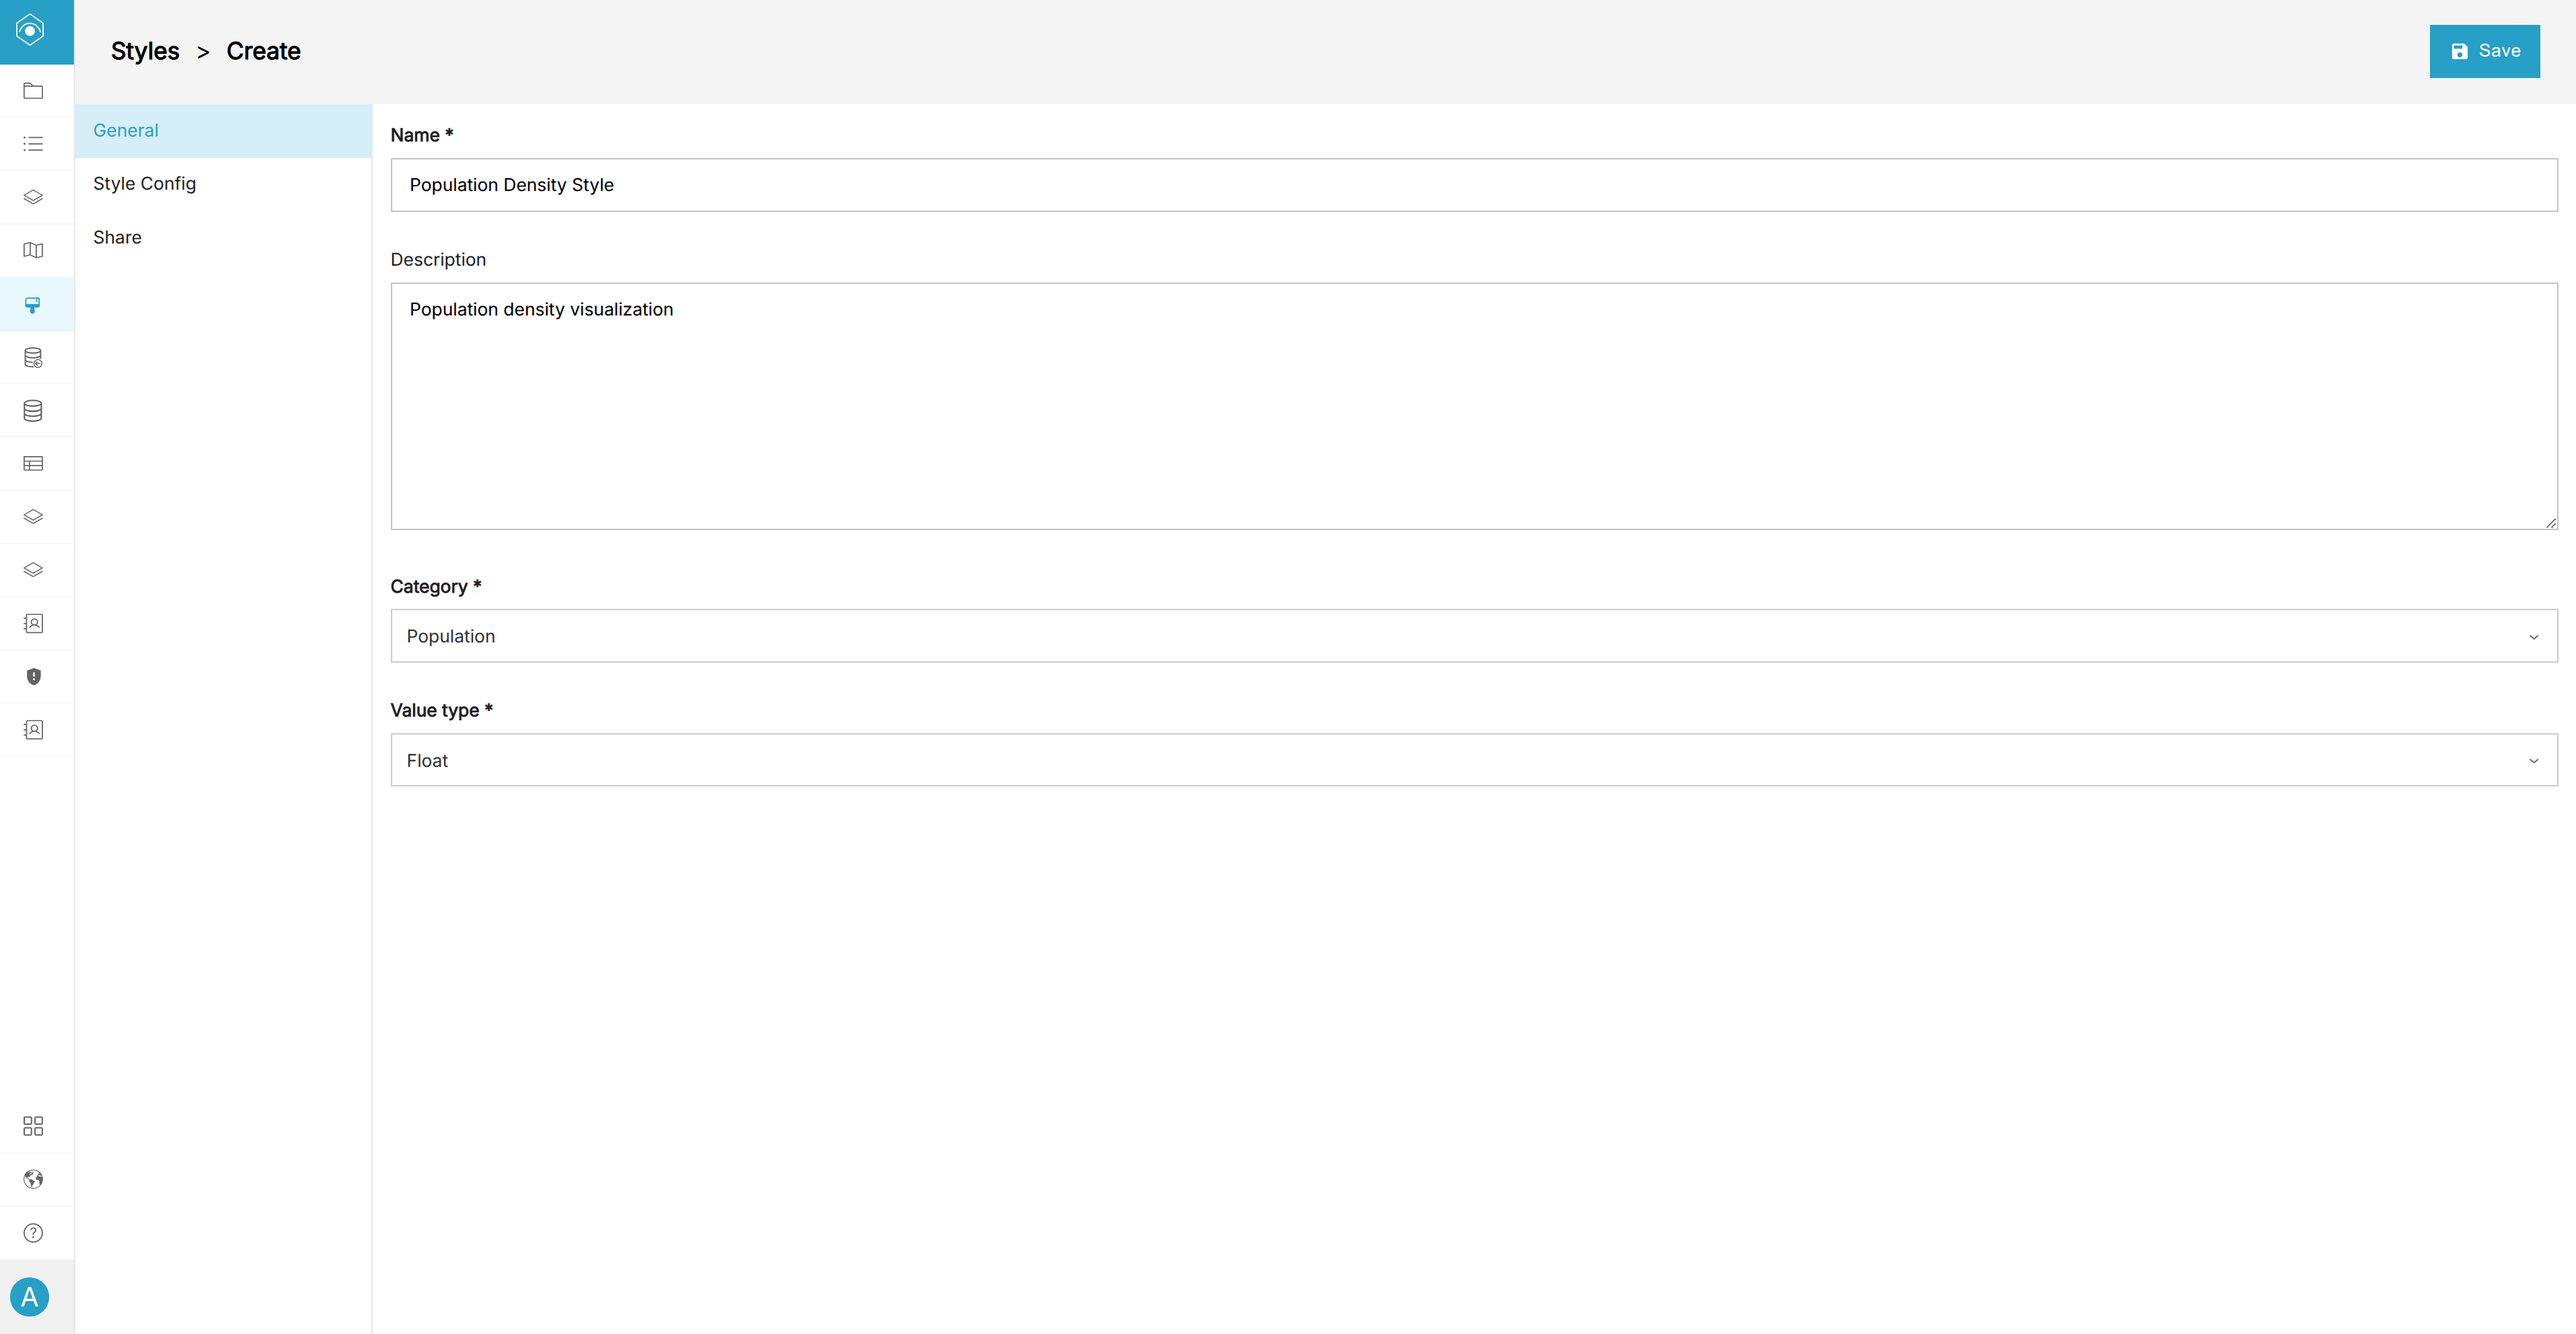
Use the following sample settings:
| Field | Example Value | Description |
|---|---|---|
| Name | Population Density Style | The display name of the style. |
| Description | Population density visualization | Optional description explaining the purpose. |
| Category | Population | Optional grouping category for organizing styles. |
| Value Type | Float | Defines if the style supports numeric or category values. |
Step 3: Configure Style Rules
The Style Config tab controls how values are classified and visualized on the map.
-
Open the Style Config tab.
-
Under Style Type, select Predefined Style.
-
Configure colour rules, classifications, or palettes.
-
Click Save.
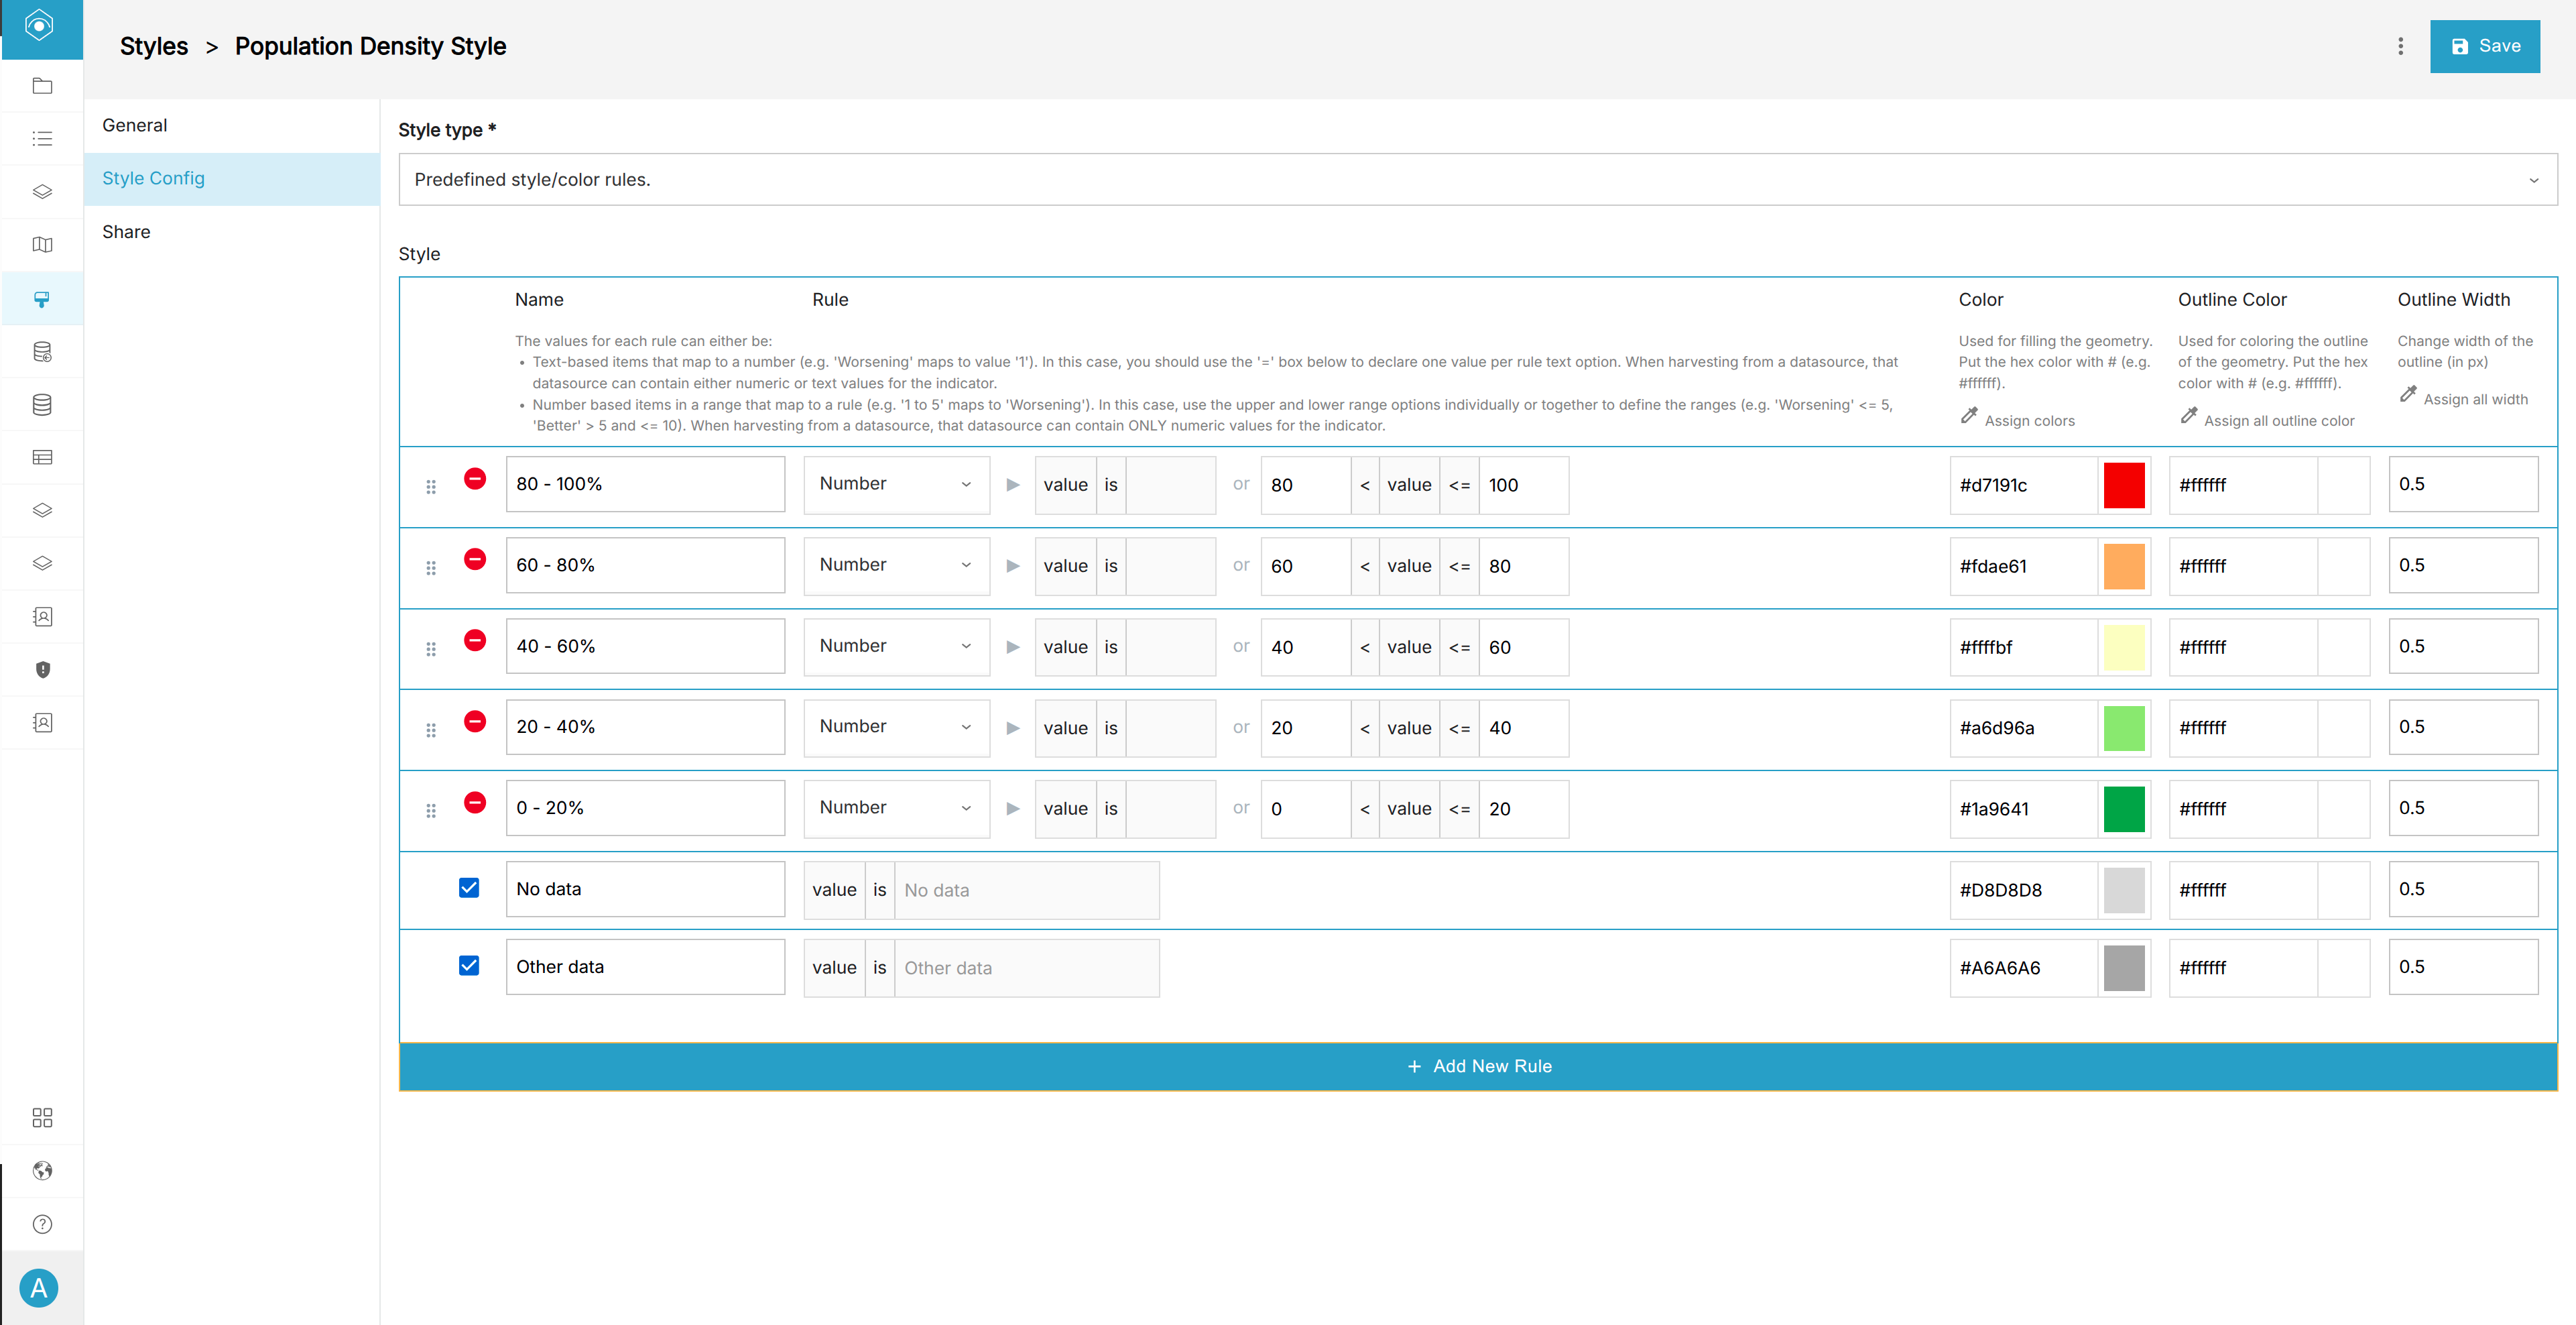
Predefined Style Rules
Predefined styles allow users to manually define custom colour rules and legends.
| Field | Description |
|---|---|
| Name | The label shown in the map legend. |
| Rule | The value or range assigned to the rule. |
| Colour | The polygon fill colour. |
| Outline Colour | The border colour for polygons. |
| Outline Width | The thickness of polygon borders. |
Example numeric ranges:
- 0 - 10
- 10 - 25
- 25 - 50
Example category mappings:
- Male (m)
- Female (f)
Step 4: Configure Dynamic Styles
Dynamic styles automatically generate classifications and colour ranges from your data.
-
Under Style Type, select Dynamic Quantitative or Dynamic Qualitative.
-
Select a colour palette.
-
Choose a classification method.
-
Define the number of classes.
-
Configure optional outline and filter settings.
-
Click Save.
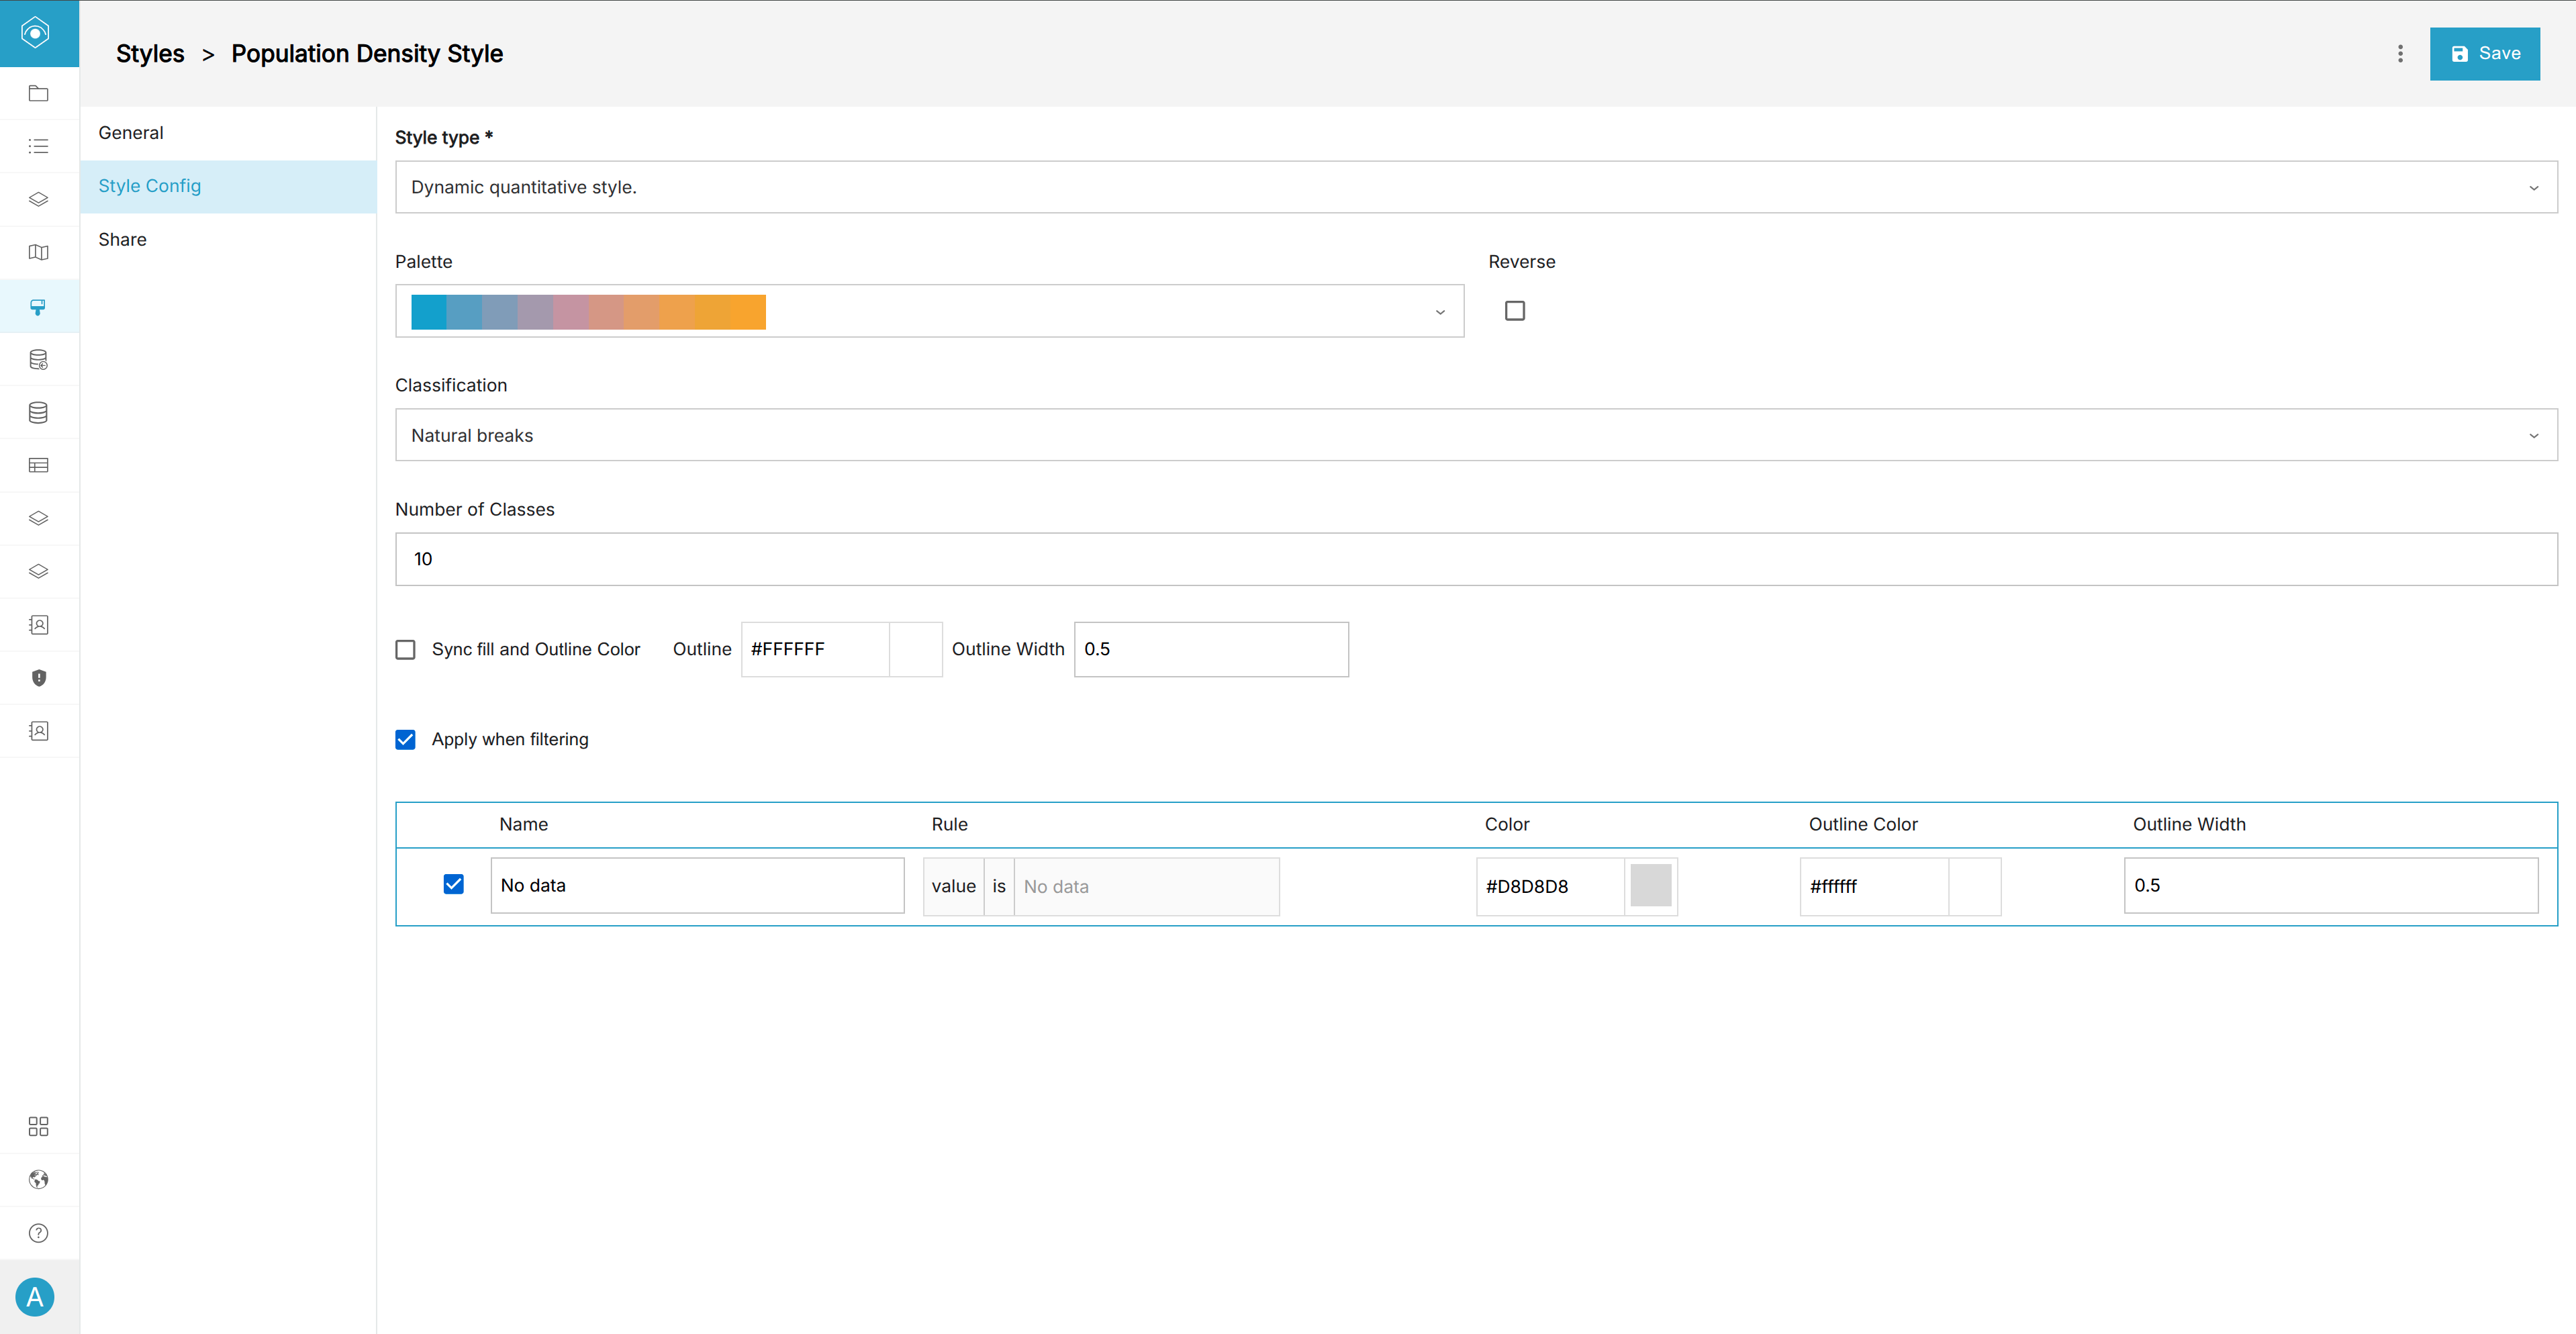
The following options are commonly available for Dynamic Quantitative styles:
| Setting | Description |
|---|---|
| Palette | Select the colour ramp used for the visualization. |
| Reverse Palette | Reverse the order of colours in the palette. |
| Classification | Select the statistical classification method. |
| Number of Classes | Define how many value classes should be generated. |
| Sync Fill & Outline | Use the same colour for polygon fills and outlines. |
| Apply When Filtering | Allow styles to update dynamically when filters are applied. |
Additional Style Concepts
GeoSight styles can exist in multiple locations throughout the platform.
| Style Location | Description |
|---|---|
| Style Library | Reusable styles stored globally within the GeoSight admin panel. |
| Indicator Style | Default styles assigned directly to indicators. |
| Override Style | Project-specific style overrides configured inside Indicator Layers. |
Next up: Learn how to create and manage Context Layers in GeoSight to add additional spatial datasets and overlays to your dashboards.