Creating Projects / Dashboards
Projects are interactive dashboards within GeoSight that combine indicators, reference datasets, layers, basemaps, widgets, and filters into a single map-based workspace.
In GeoSight, the terms Project and Dashboard are often used interchangeably. A project acts as the main environment where users visualize, explore, and analyse spatial indicator data.
The Projects page allows users to:
| Function | Description |
|---|---|
| Create Projects | Build new dashboards using indicators, layers, and basemaps. |
| Configure Map Views | Select reference datasets, extents, and administrative levels. |
| Manage Indicator Layers | Add and organize indicator visualizations within the dashboard. |
| Add Context Layers | Include supporting geospatial datasets and overlays. |
| Manage Basemaps | Select background map layers available to dashboard users. |
| Configure Widgets & Filters | Create interactive summaries, charts, and filtering tools. |
| Share Dashboards | Control access permissions for users, groups, or the public. |
Step 1: Open the Projects Page
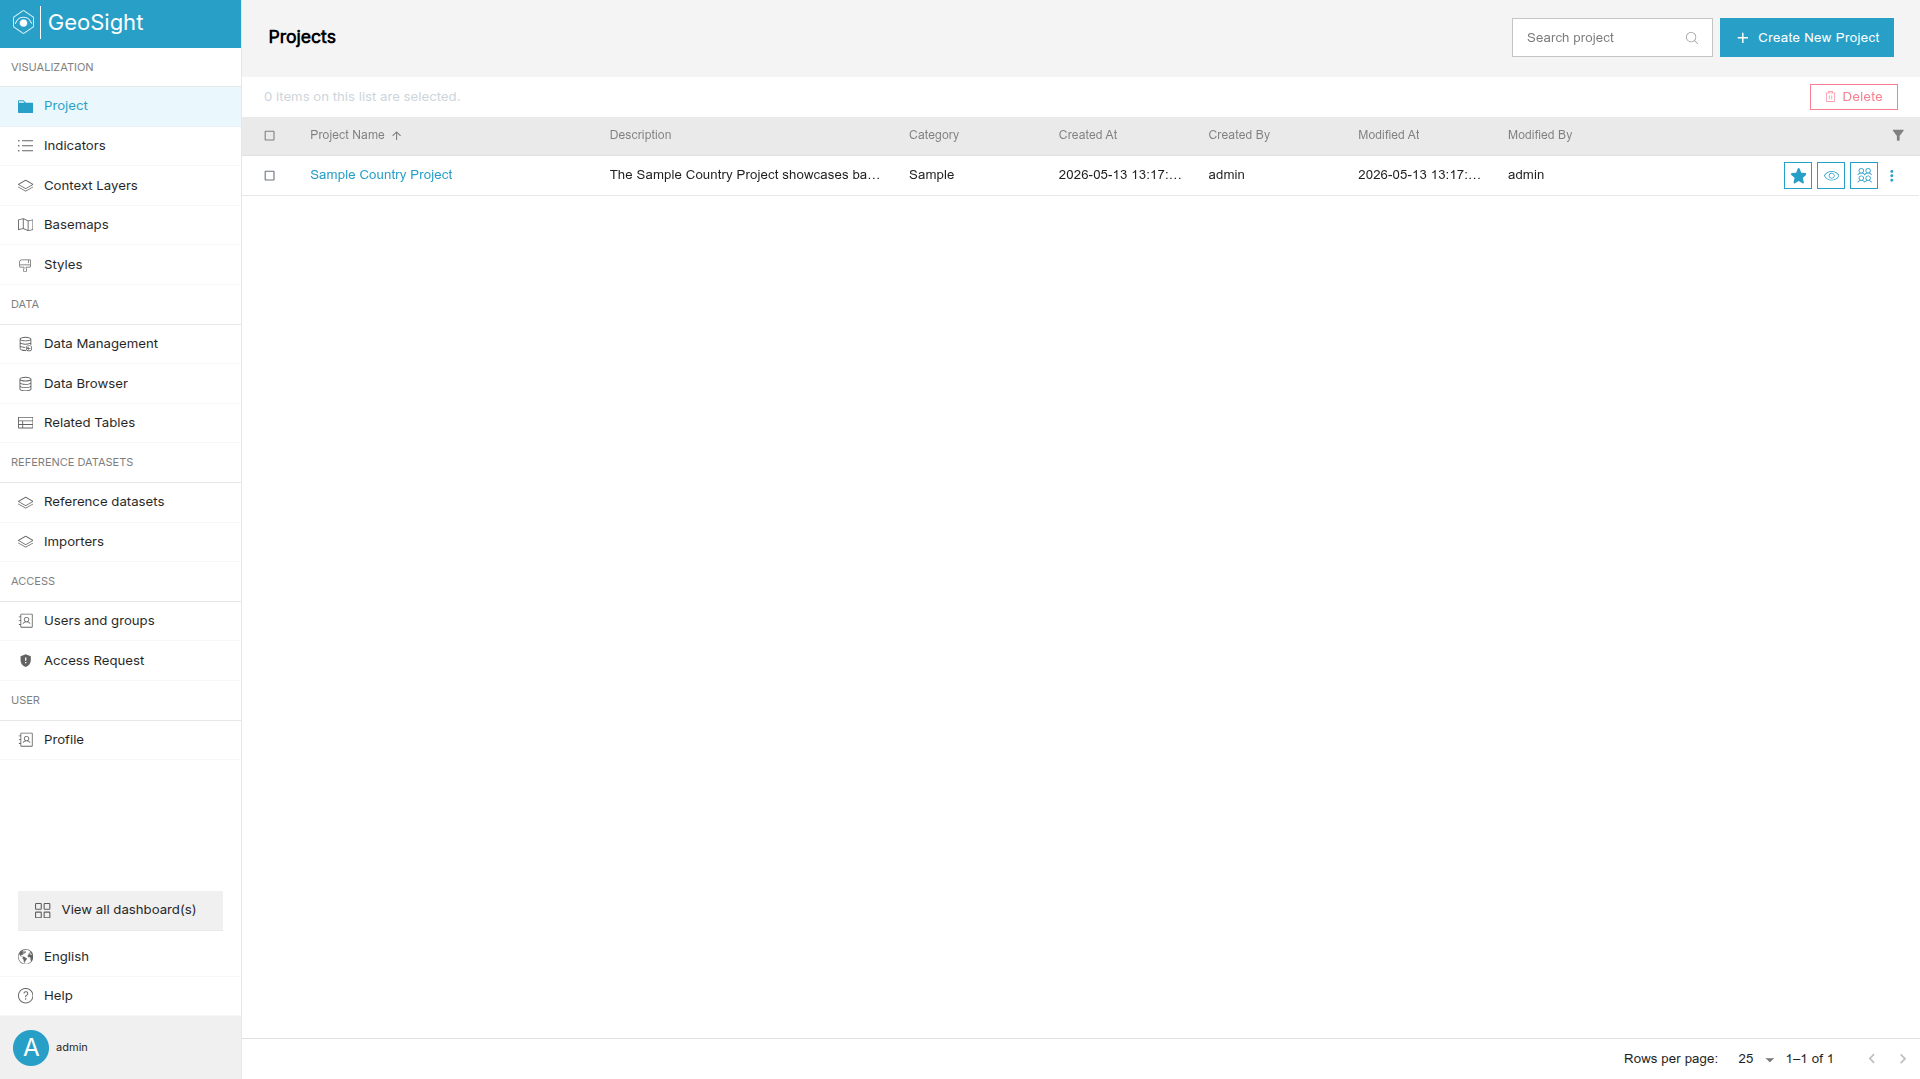
The Projects page is the central location for creating and managing GeoSight dashboards.
-
In the left-side navigation panel, click Projects.
-
Use the available search and filter tools to locate existing dashboards.
-
Click Create New Project.
Step 2: General Project Settings
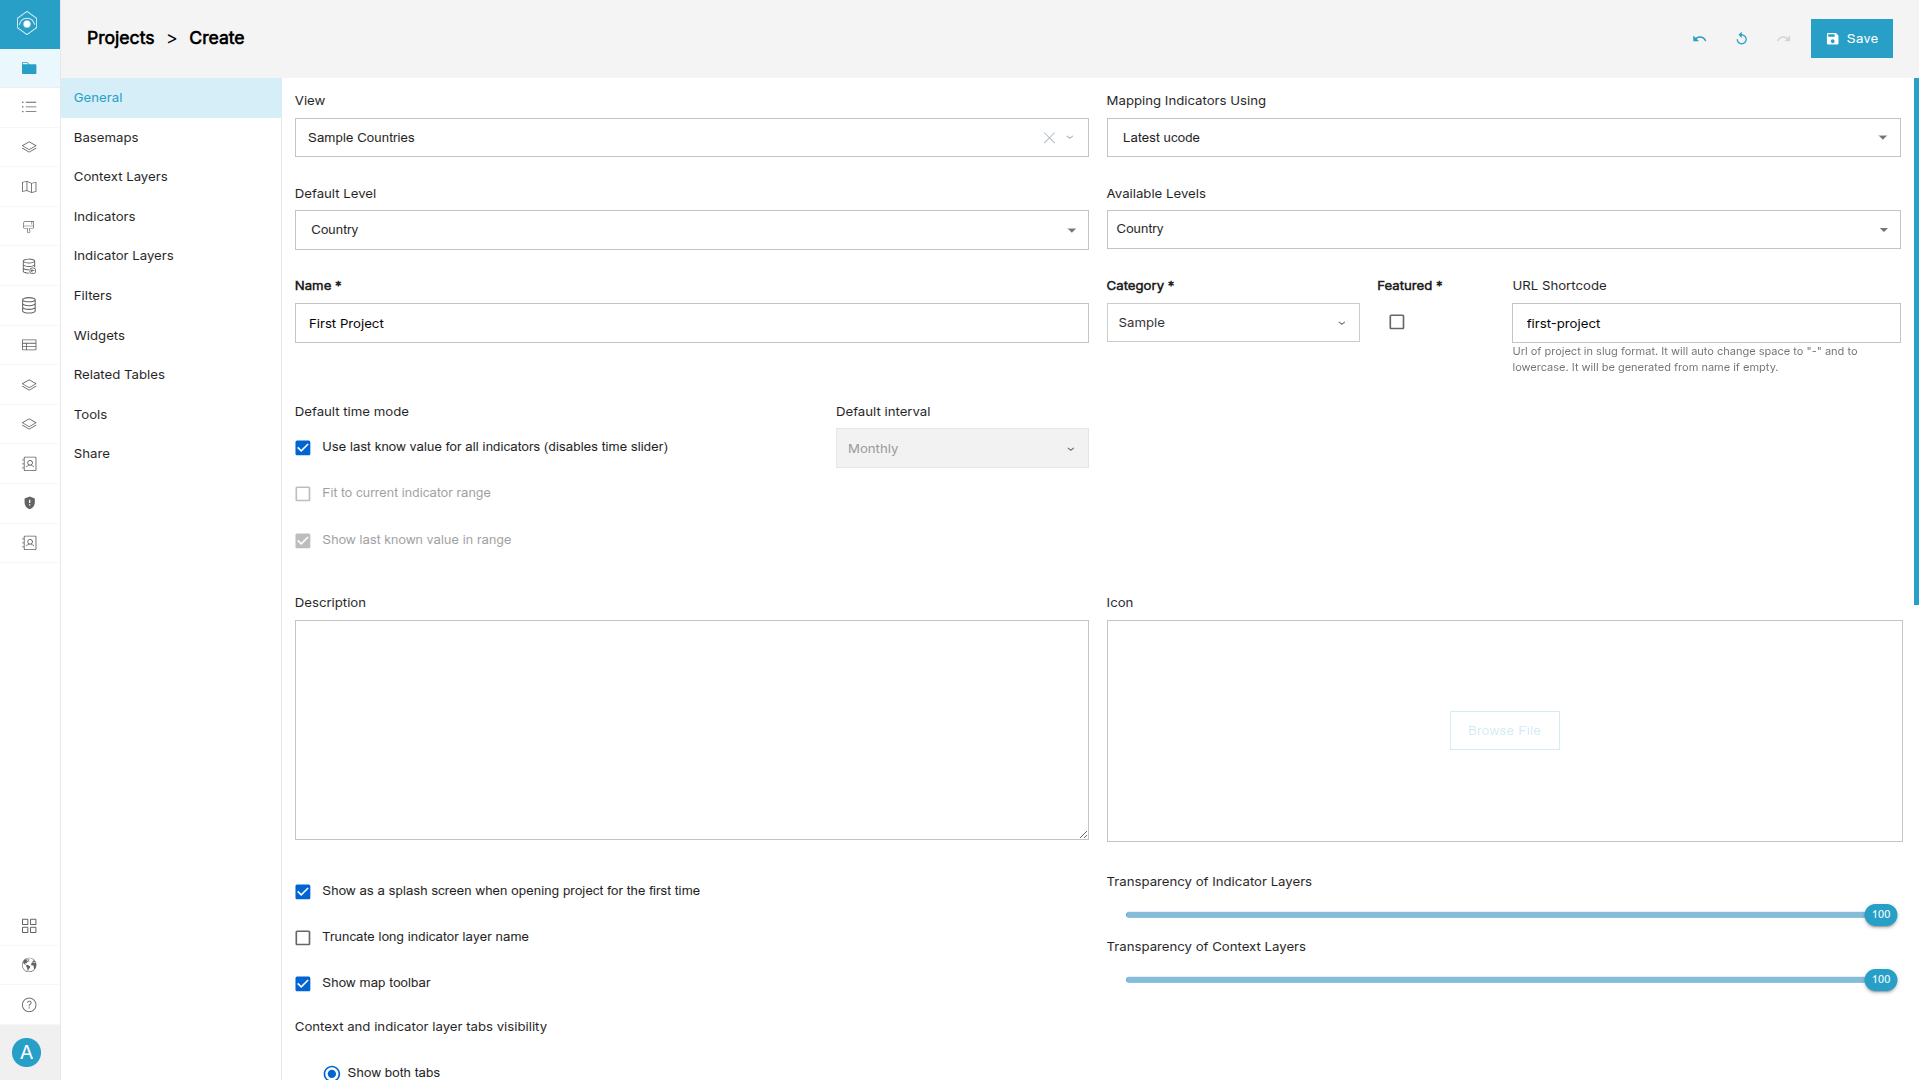
The General tab defines the core dashboard settings, including the reference dataset and default map behaviour.
-
Enter a project name (e.g. First Project).
-
Select the appropriate reference dataset or View.
-
Configure optional settings such as extent, levels, and repository type if required.
Step 3: Add Indicators
Indicators connect the dashboard to the data stored within GeoSight.
-
Open the Indicators tab.
-
Click Add Indicator.
-
Select Sample Indicator A.
-
Click Update Selection.
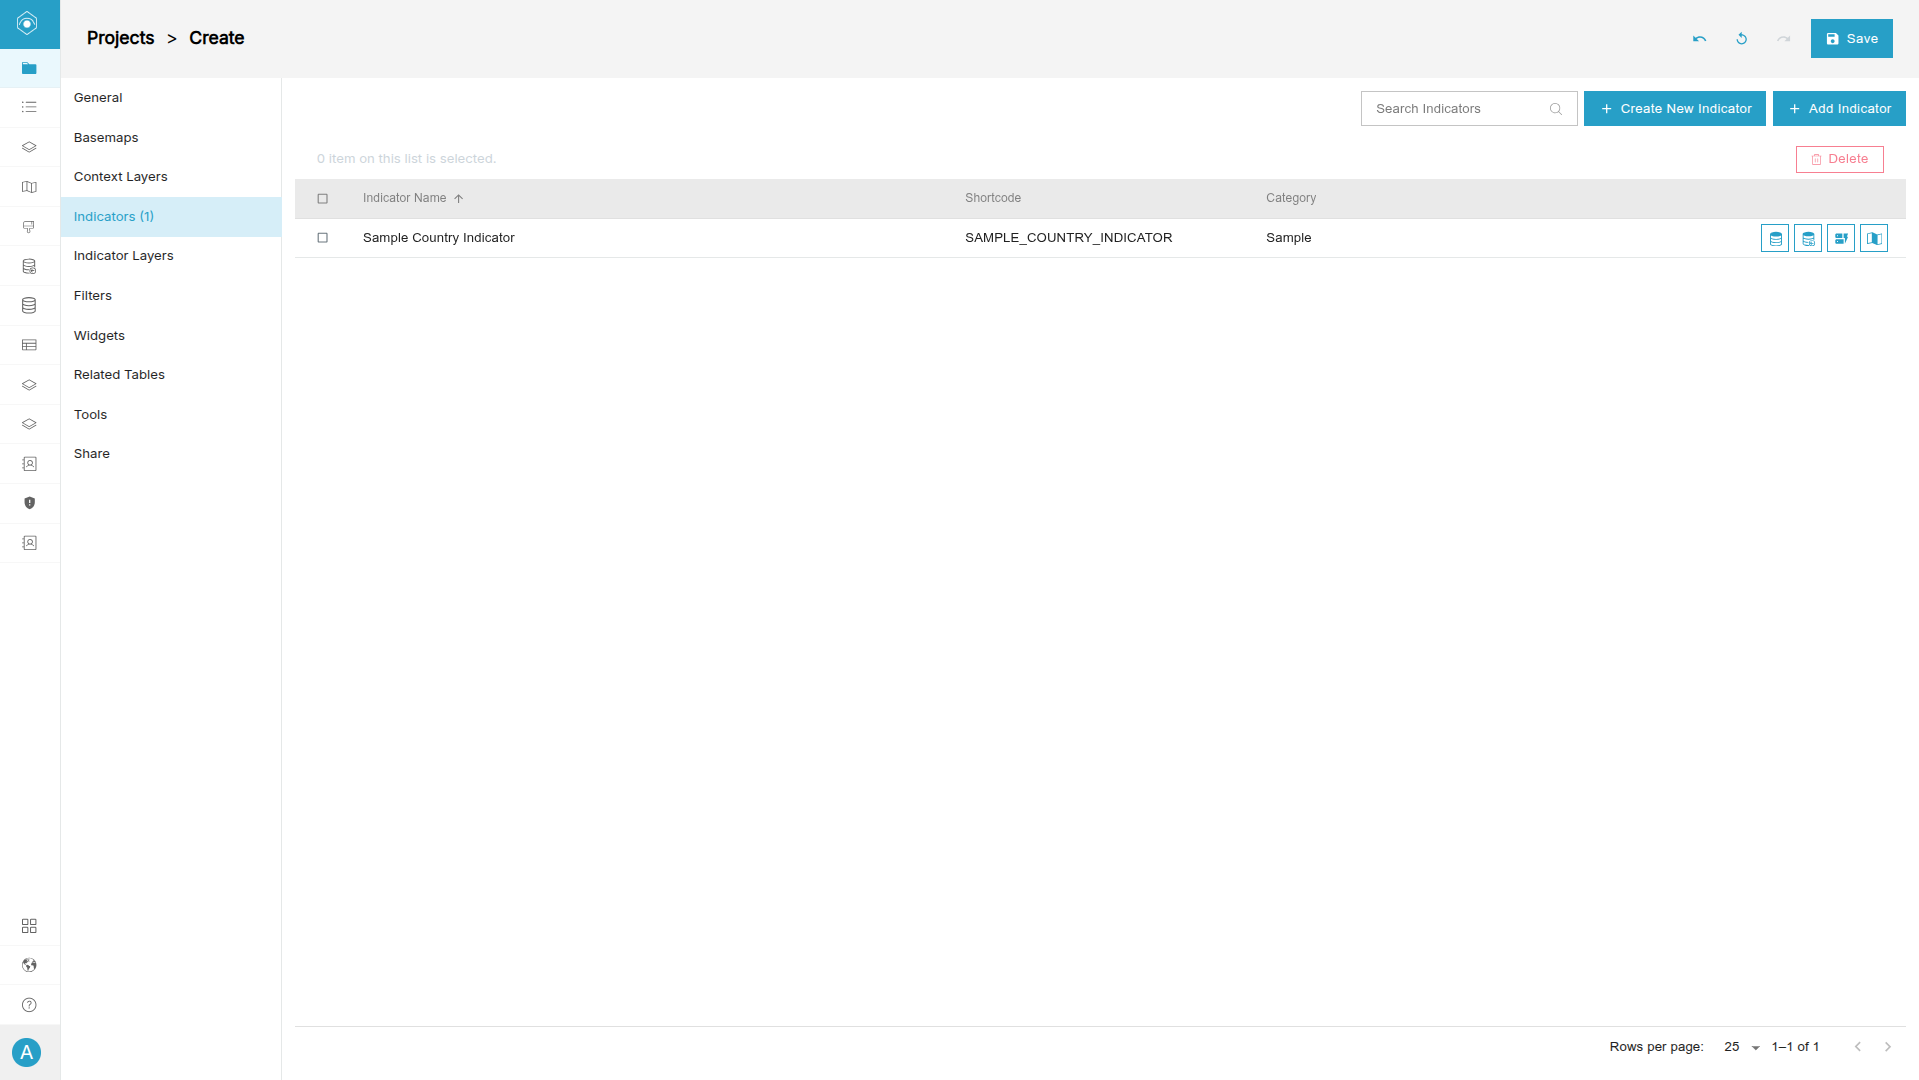
The Indicators tab allows dashboards to access data for:
- Widgets
- Filters
- Charts
- Indicator layers
- Analytical tools
Step 4: Configure Indicator Layers
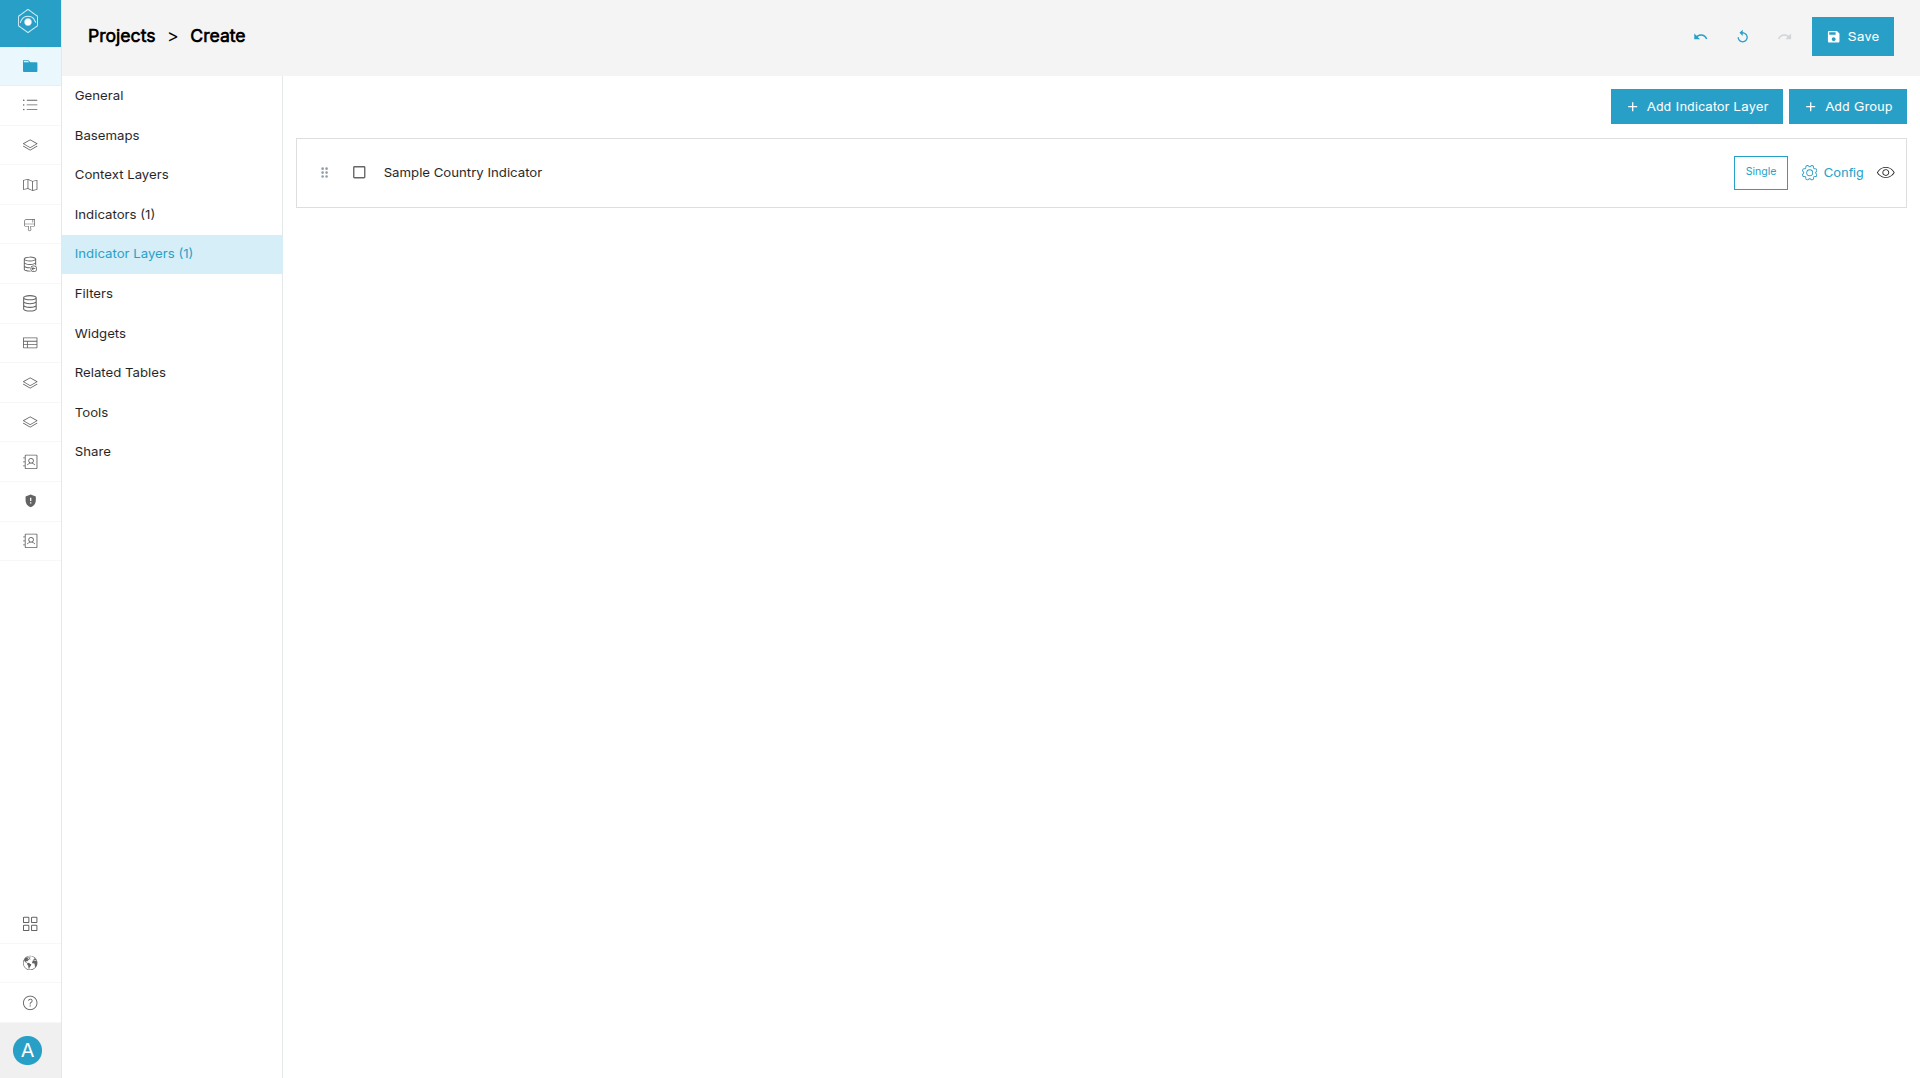
Indicator Layers control how indicator data is visualized on the map.
-
Open the Indicator Layers tab.
-
Click Add Indicator Layer.
-
Choose Single Indicator Layer.
-
Select Sample Indicator A.
-
Click Apply Selection.
GeoSight supports several indicator layer types:
| Layer Type | Description |
|---|---|
| Single Indicator Layer | Displays one indicator dataset on the map. |
| Multi-Indicator Layer | Combines multiple indicators using charts such as pie or bar graphs. |
| Dynamic Layer | Uses custom expressions and filtering logic for advanced visualization. |
| Related Table Layer | Displays summarized data from related tables. |
Step 5: Add Basemaps
Basemaps provide the geographic background displayed beneath your indicator layers.
-
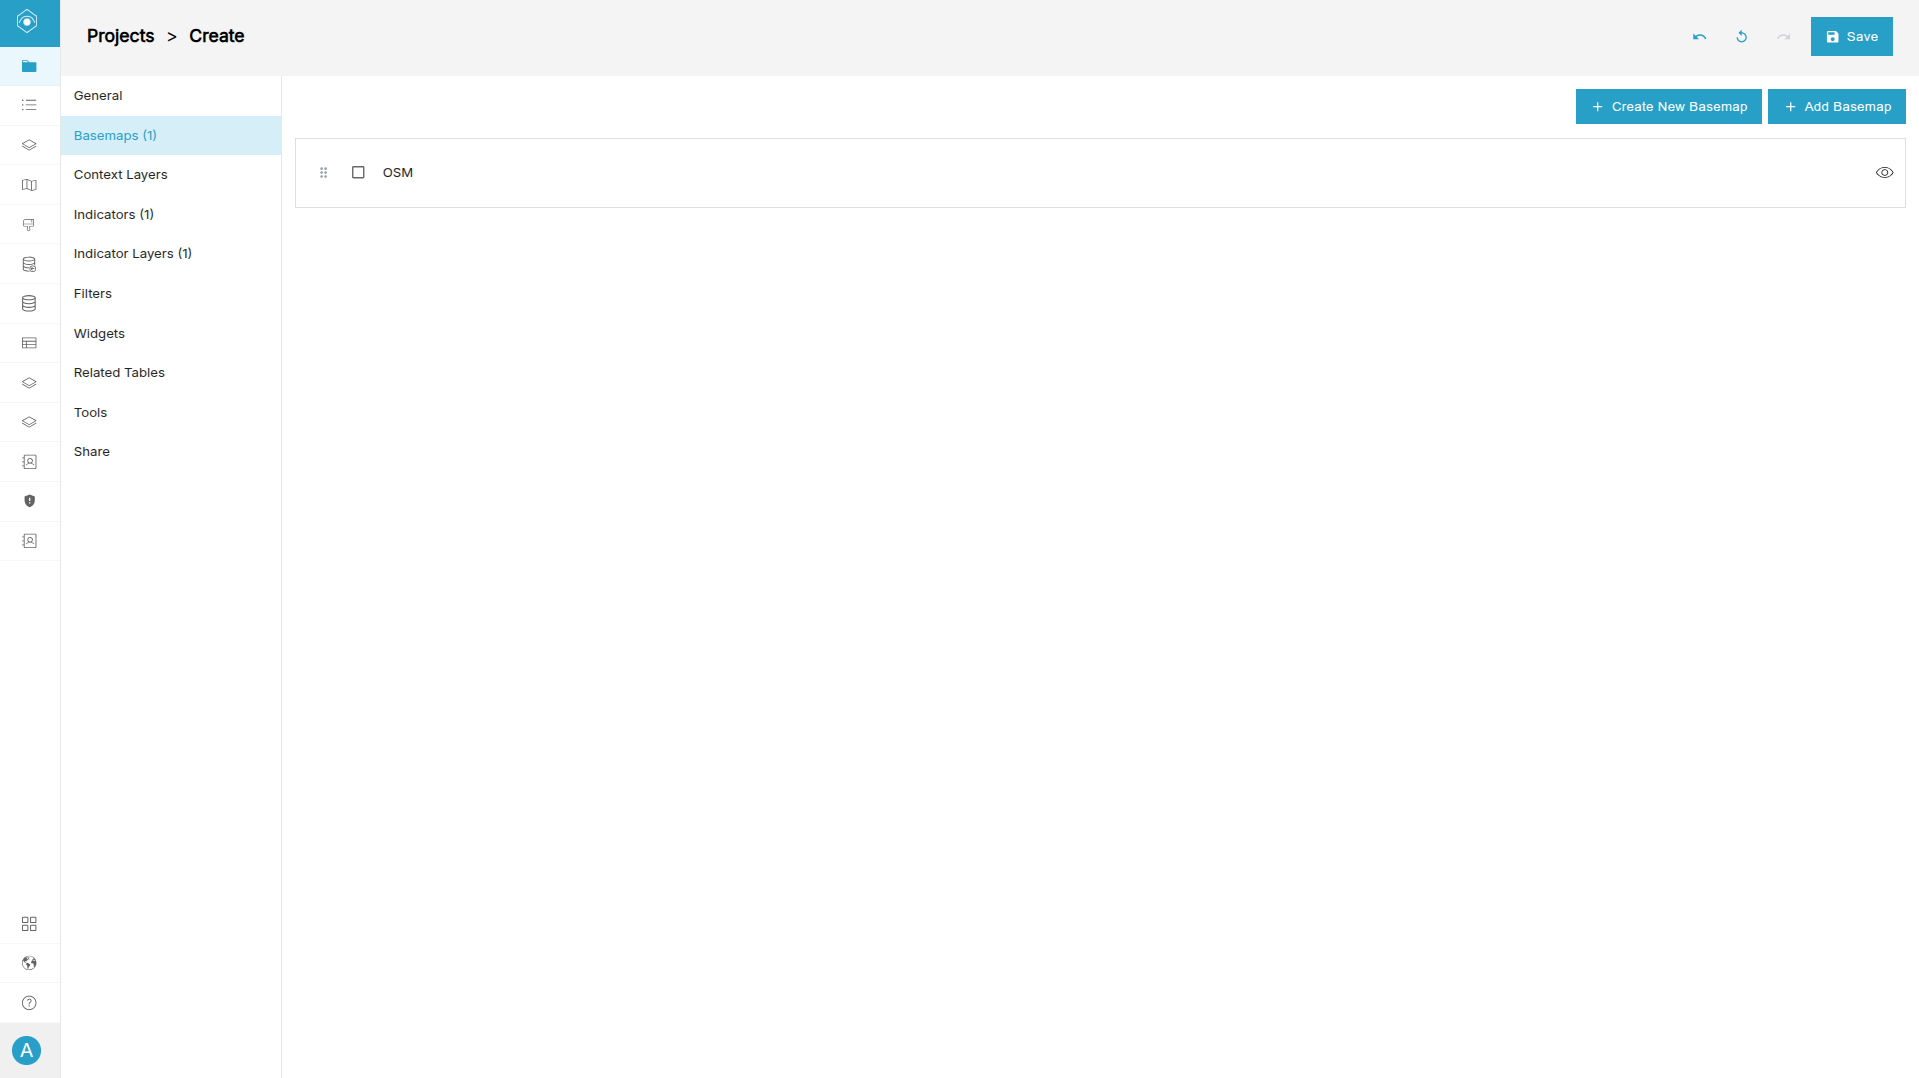
Open the Basemaps tab.
-
Click Add Basemap.
-
Select Open Street Map.
-
Click Apply Selection.
-
Click Save.
Step 6: Preview the Dashboard
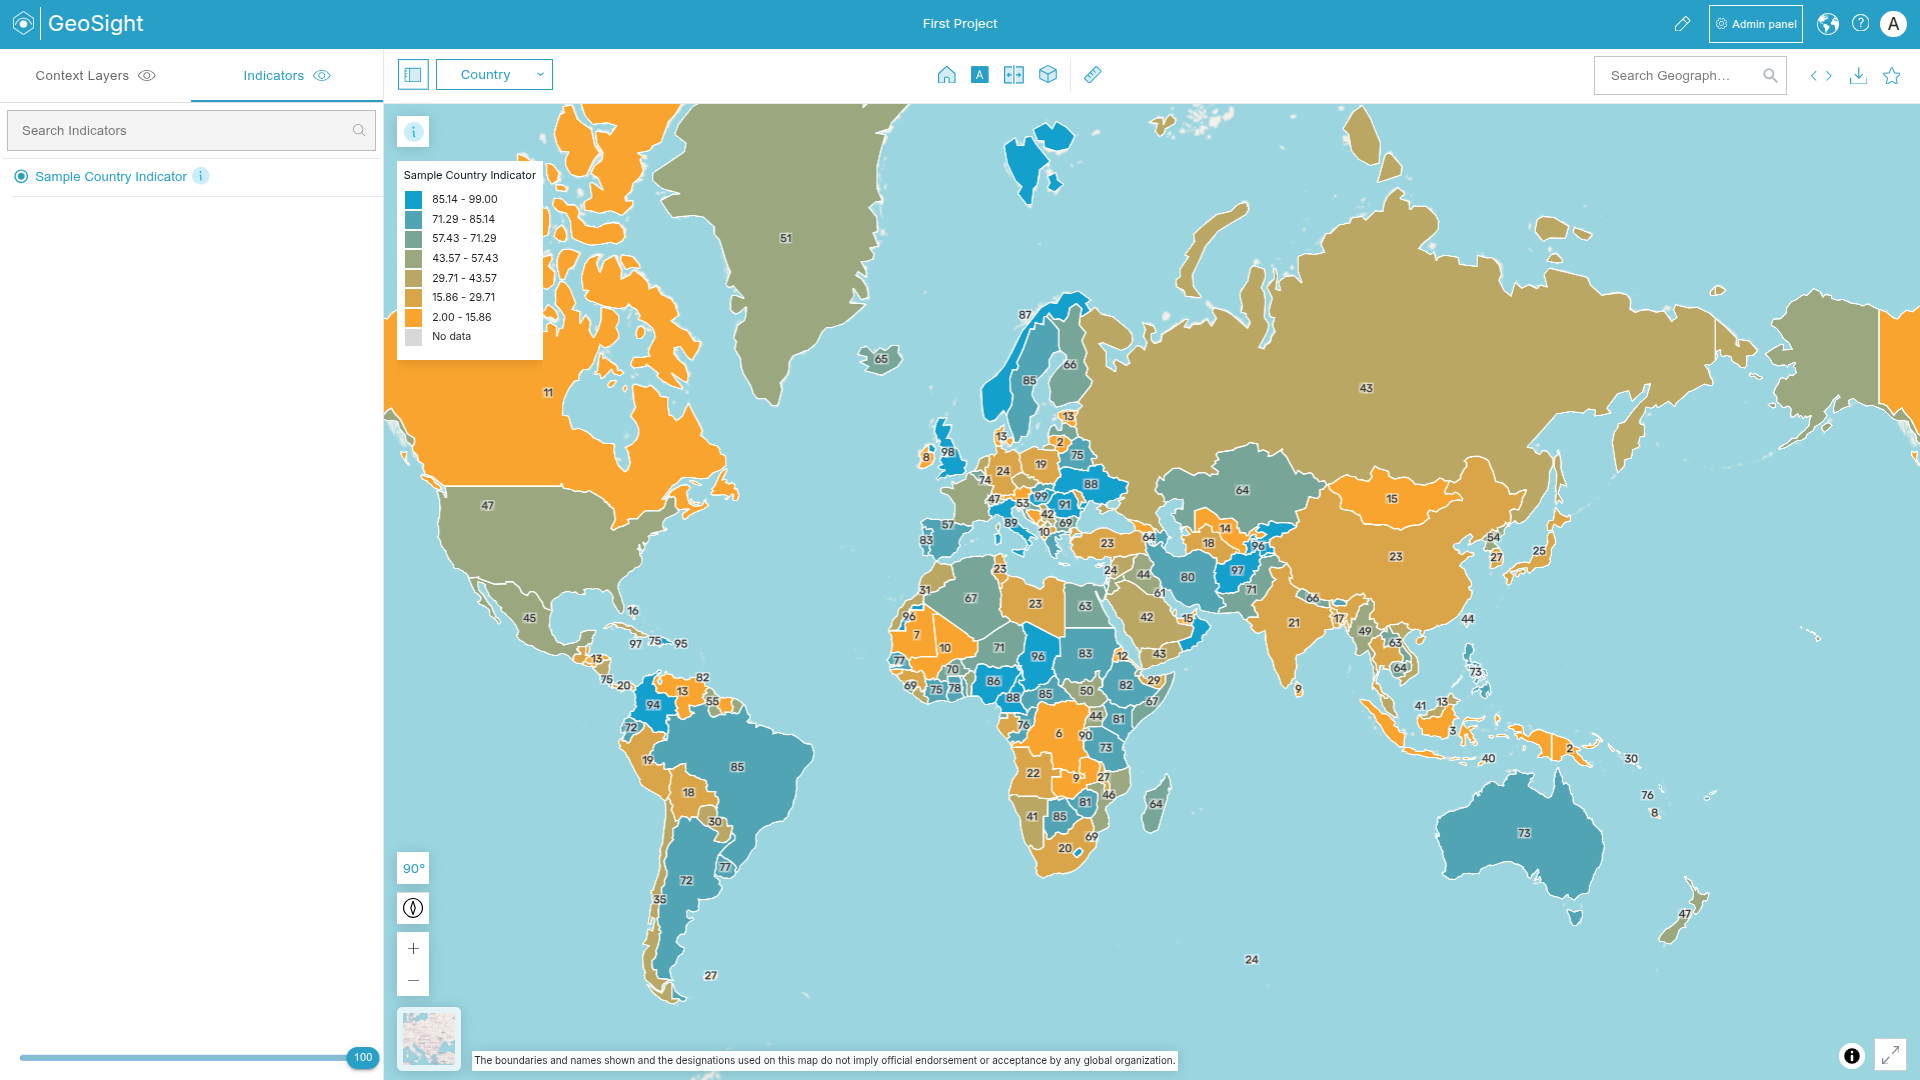
Once saved, the dashboard can be opened and explored interactively within GeoSight.
-
Click Preview.
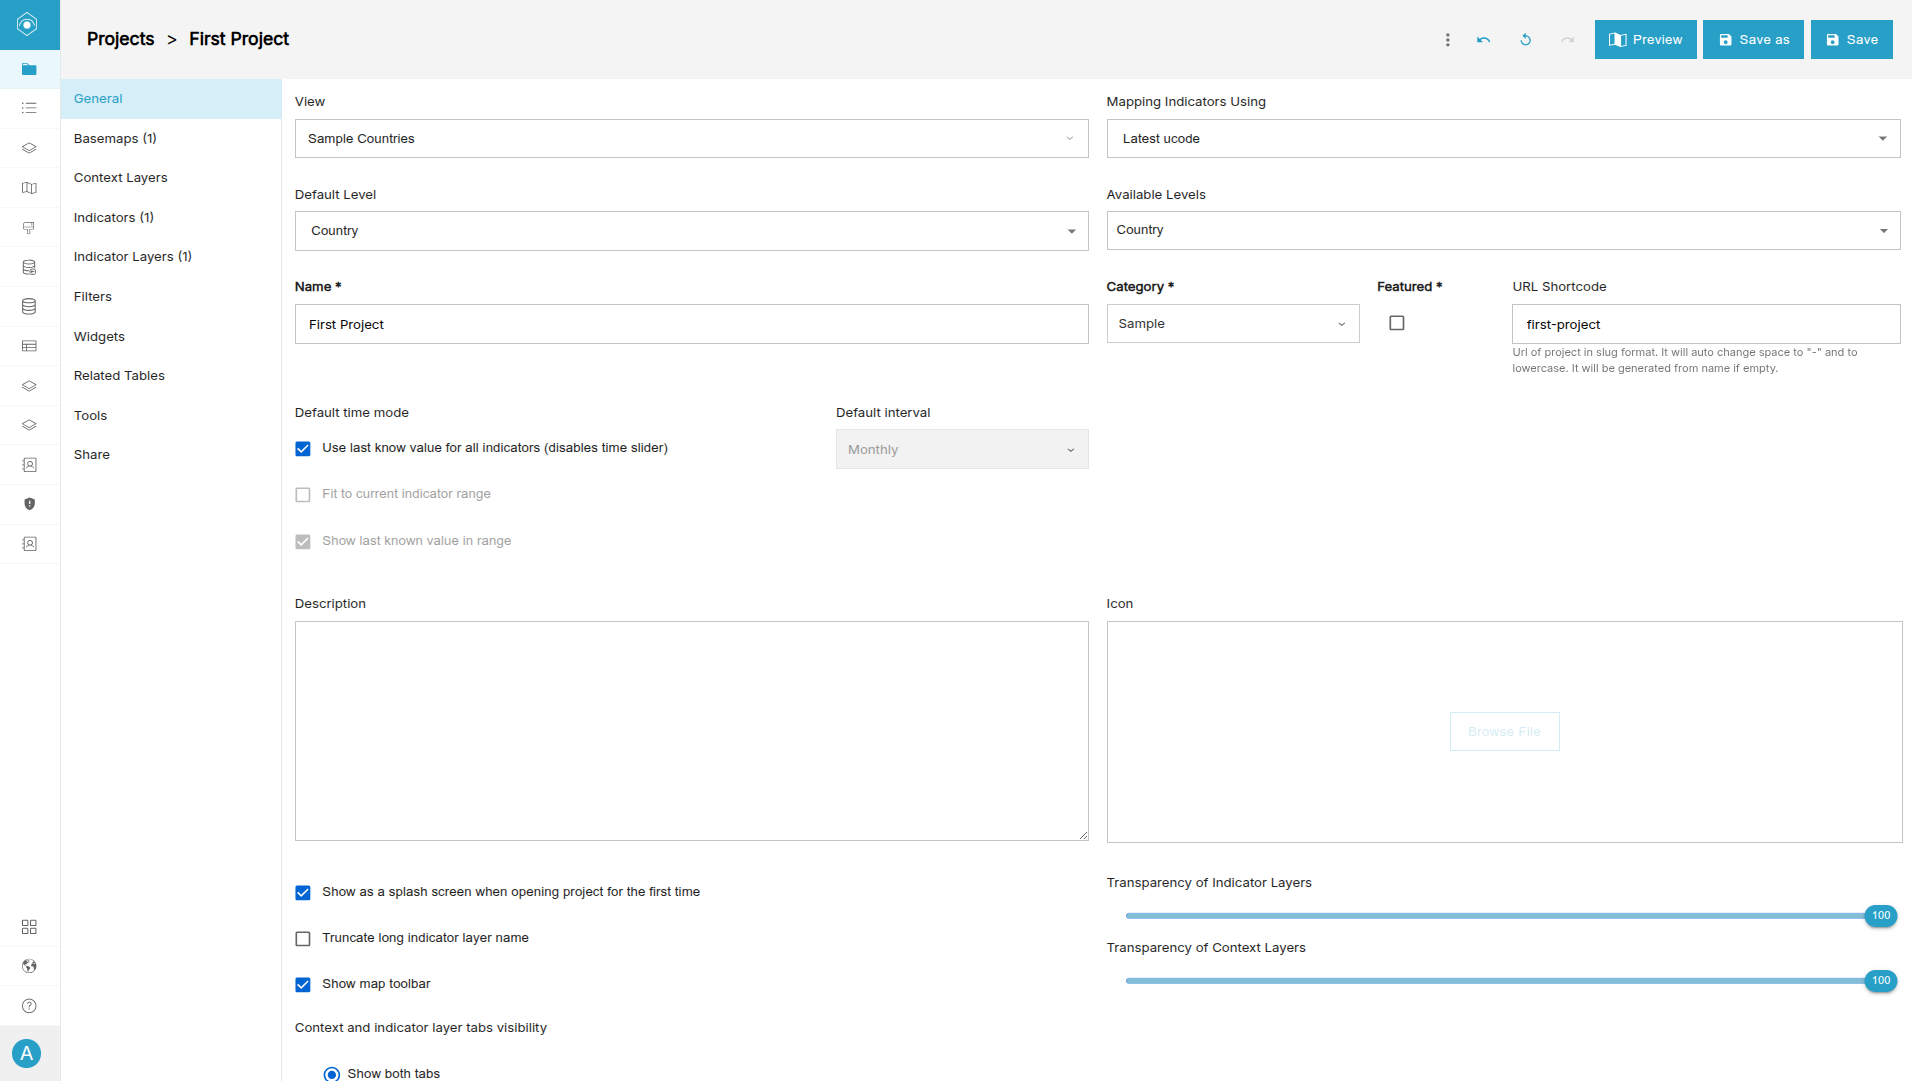 Image credit: GeoSight
 -
Explore the map interface, layers, filters, and indicator tools.
-
Verify that your indicators, basemaps, and administrative boundaries display correctly.
Additional Project Components
GeoSight dashboards support several additional configuration sections.
| Component | Description |
|---|---|
| Context Layers | Add external geospatial overlays and supporting datasets. |
| Filters | Create interactive filtering tools for indicator data. |
| Widgets | Display charts, summaries, and statistical outputs. |
| Related Tables | Connect related datasets for advanced analysis. |
| Share | Control dashboard access permissions. |
Next up: Learn how to create and configure Styles in GeoSight to control colours, classifications, labels, and map visualization behaviour.