Creating Indicators
Indicators are the core data containers within GeoSight. They store and organize statistical or thematic information across multiple geographies and time periods, allowing data to be visualized consistently across dashboards and maps.
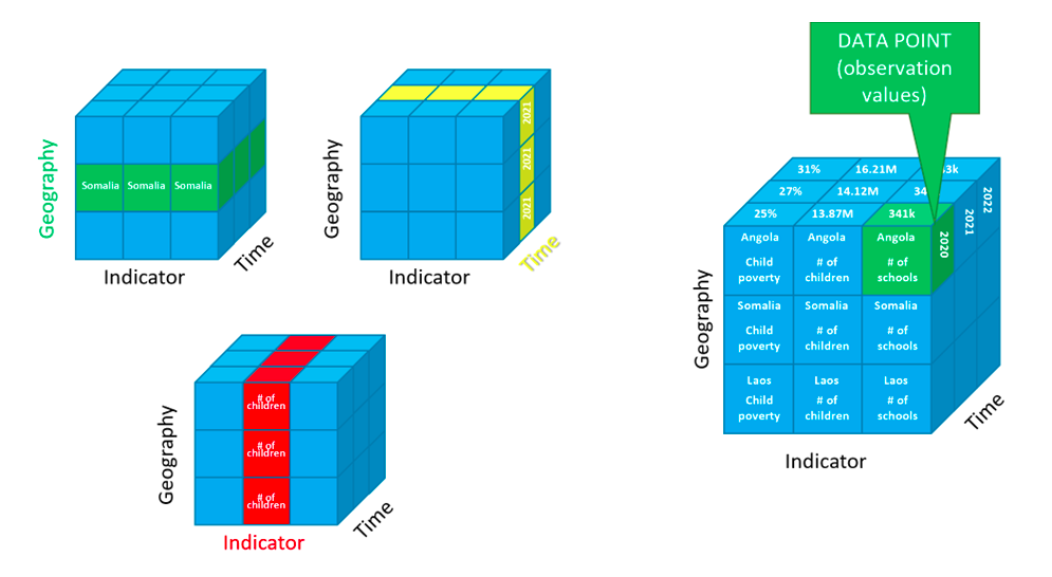
Unlike traditional systems that require separate datasets for different countries or years, GeoSight stores all related observations inside a single indicator using dimensions such as:
- Geography
- Time
- Value
- Category
This approach simplifies data management, improves consistency, and reduces duplicate datasets across projects.
The Indicators page allows users to:
| Function | Description |
|---|---|
| Create Indicators | Create new indicators and configure metadata, styles, labels, and aggregation. |
| Search & Filter | Find indicators quickly using search tools, sorting, and filters. |
| Edit Indicators | Update existing indicator settings, styles, labels, or metadata. |
| Import Data | Upload Excel or API-based indicator data into an existing indicator. |
| Browse Data | View, validate, and manage imported indicator records. |
| Share Access | Control which users or groups can access or manage the indicator. |
Step 1: Open the Indicators Page
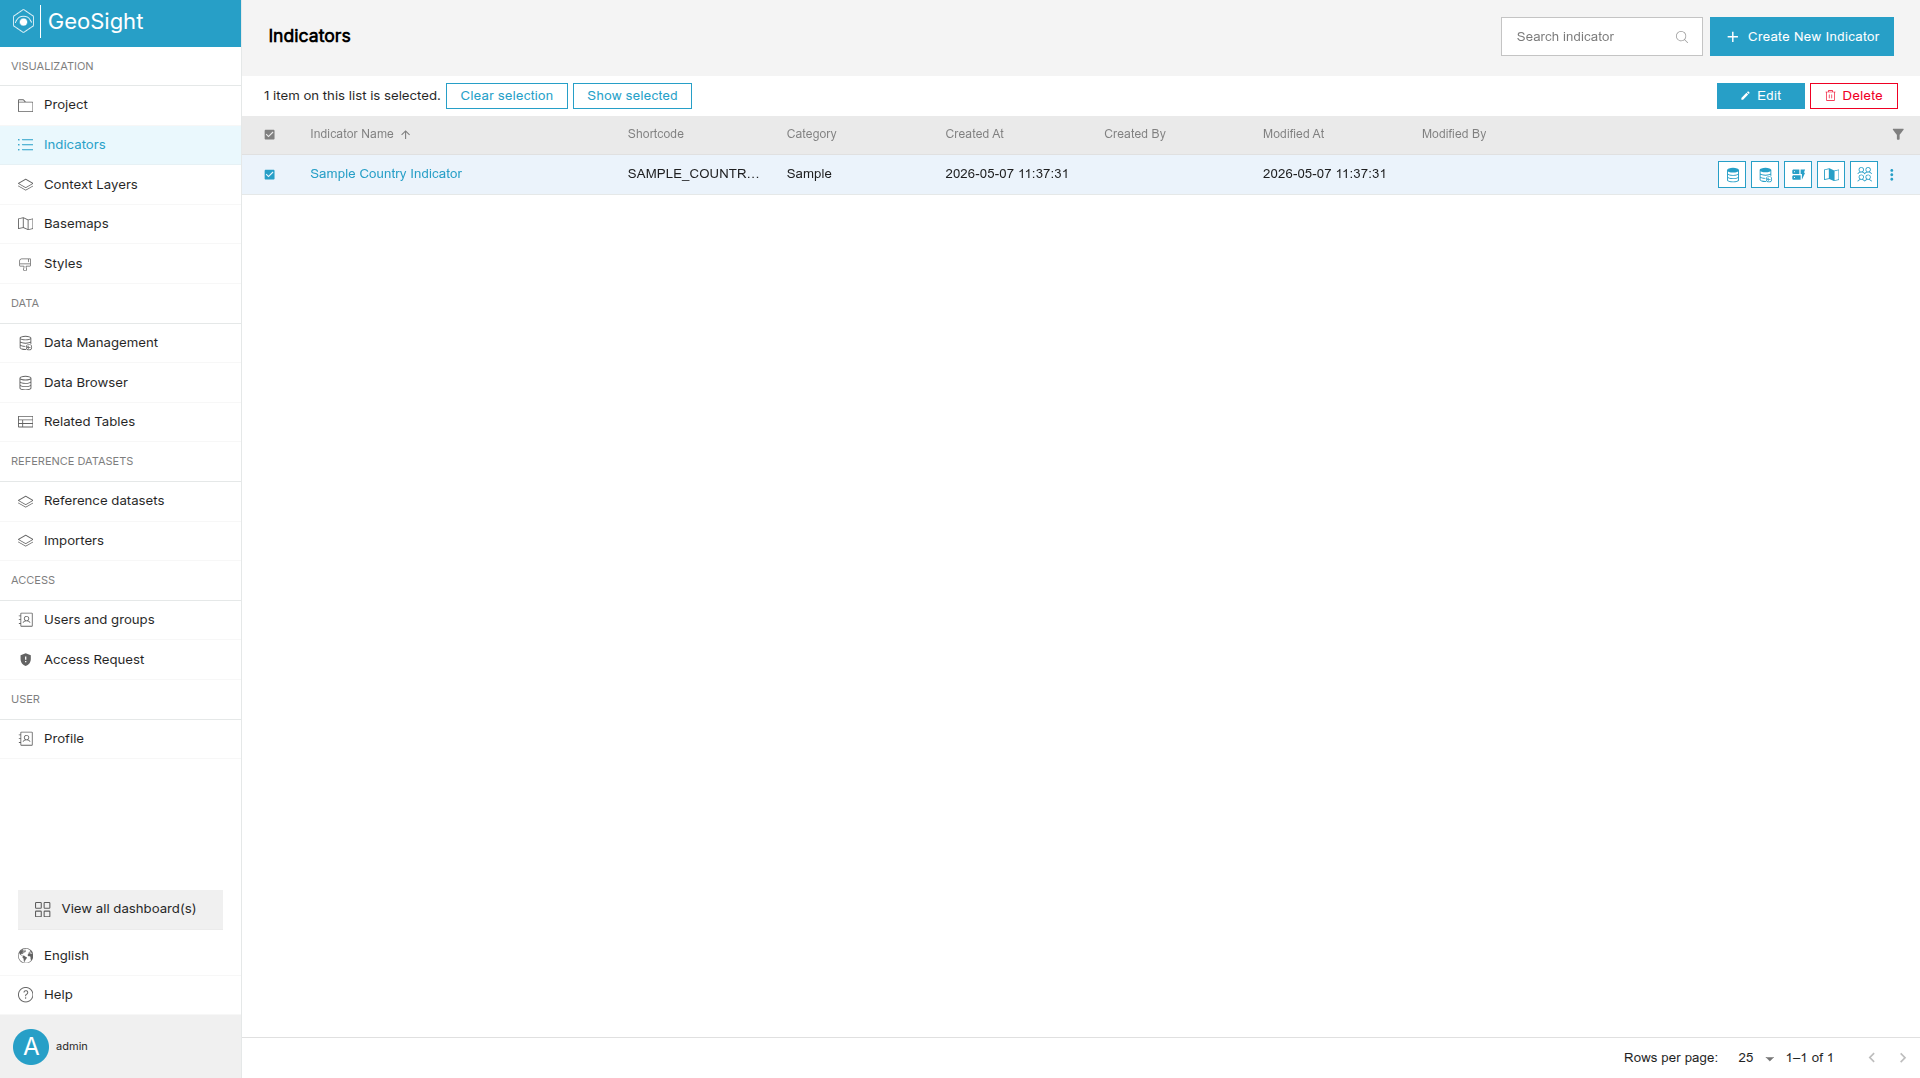
The Indicators page is the central hub for managing all indicators you have access to.
-
In the left-side navigation panel, click Indicators.
-
Use the Search field to locate existing indicators.
-
Select an indicator checkbox to enable editing or deletion options.
Step 2: Create a New Indicator
Creating an indicator defines the structure, metadata, and visualization settings before any data is imported.
-
Click Create New Indicator.
-
Complete the required fields in the General tab.
-
Configure optional settings such as aggregation, styling, and labels.
-
Click Save.
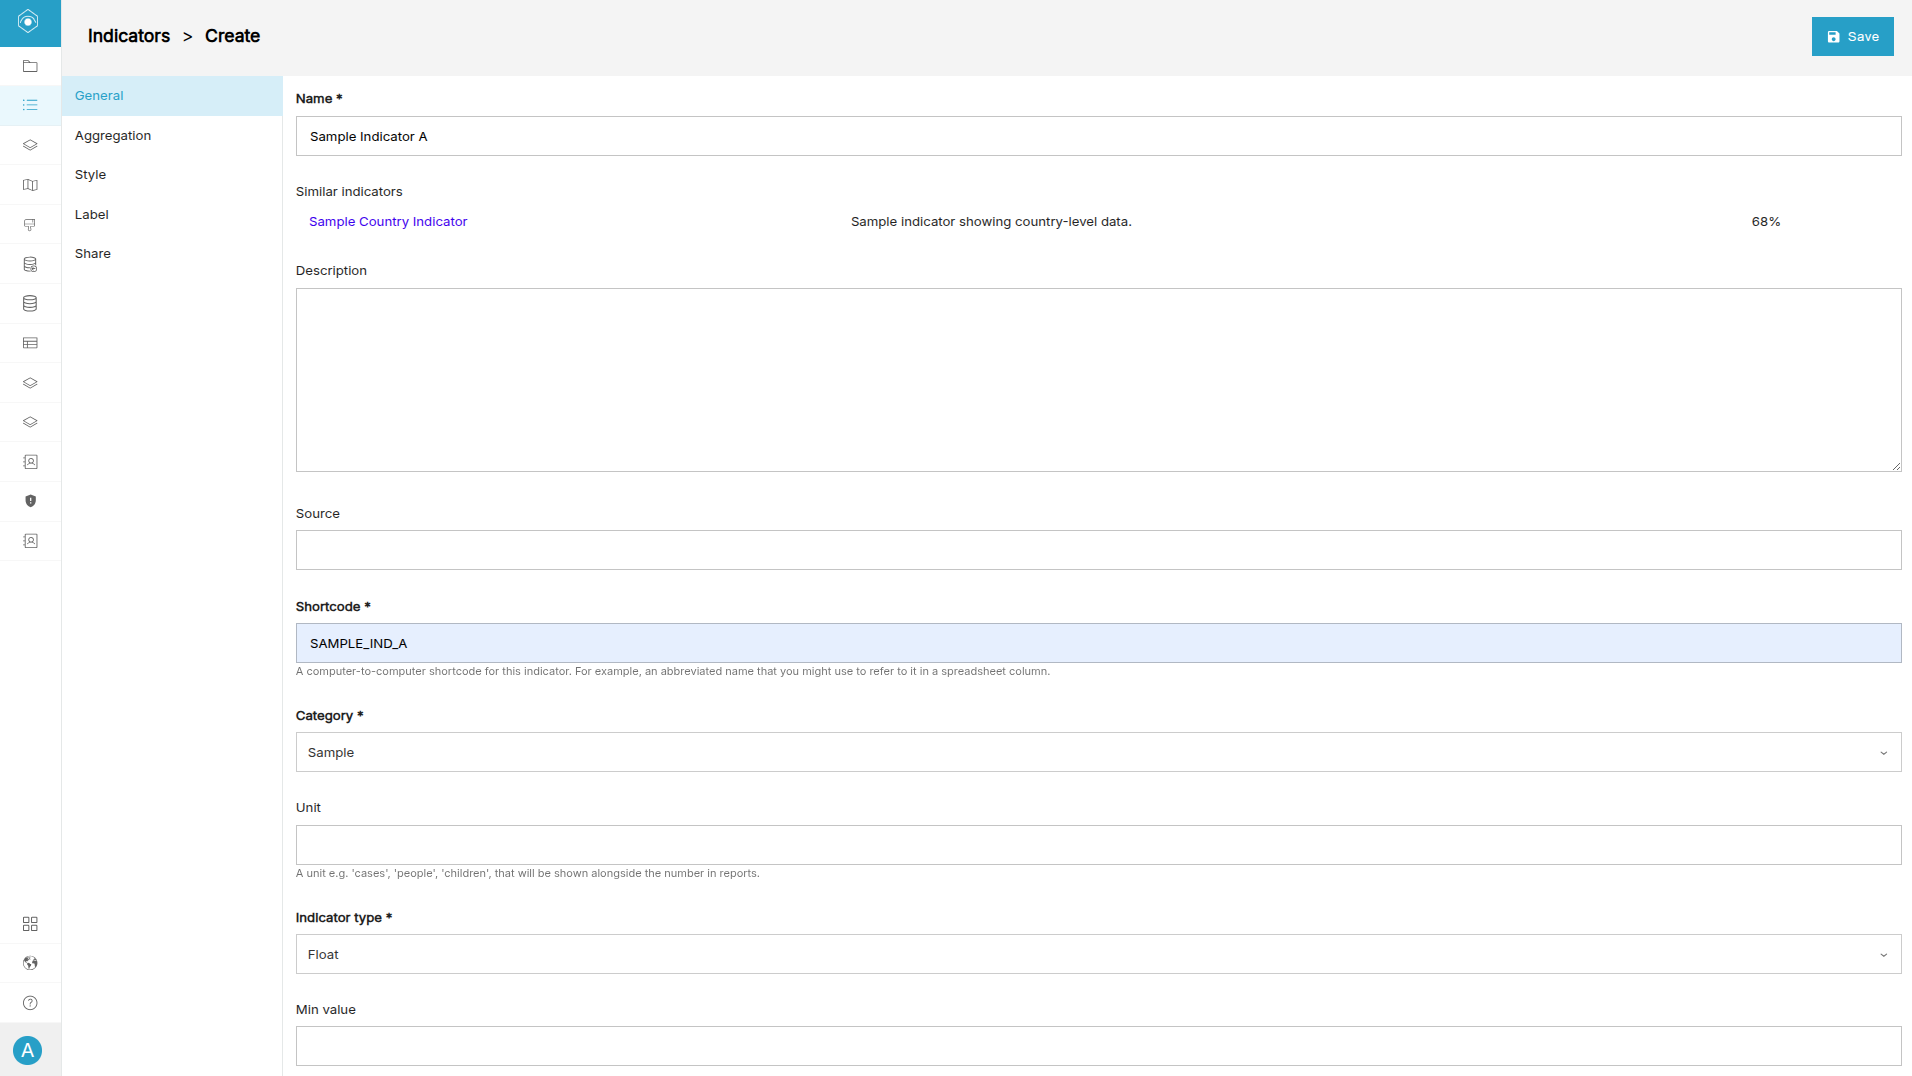
The General tab contains the core metadata and configuration for the indicator.
| Field | Description |
|---|---|
| Name | The display name of the indicator. |
| Description | Optional metadata describing methodology, context, or calculation details. |
| Source | Optional information about the source of the data. |
| Shortcode | A globally unique identifier used during imports and integrations. |
| Category | The thematic category assigned to the indicator. |
| Unit | The measurement unit for the indicator (e.g. %, people, hectares). |
| Indicator Type | Defines whether the indicator stores Integer, Float, or Category values. |
| Min / Max Value | Optional value range limits used for validation or styling. |
Step 3: Configure Aggregation
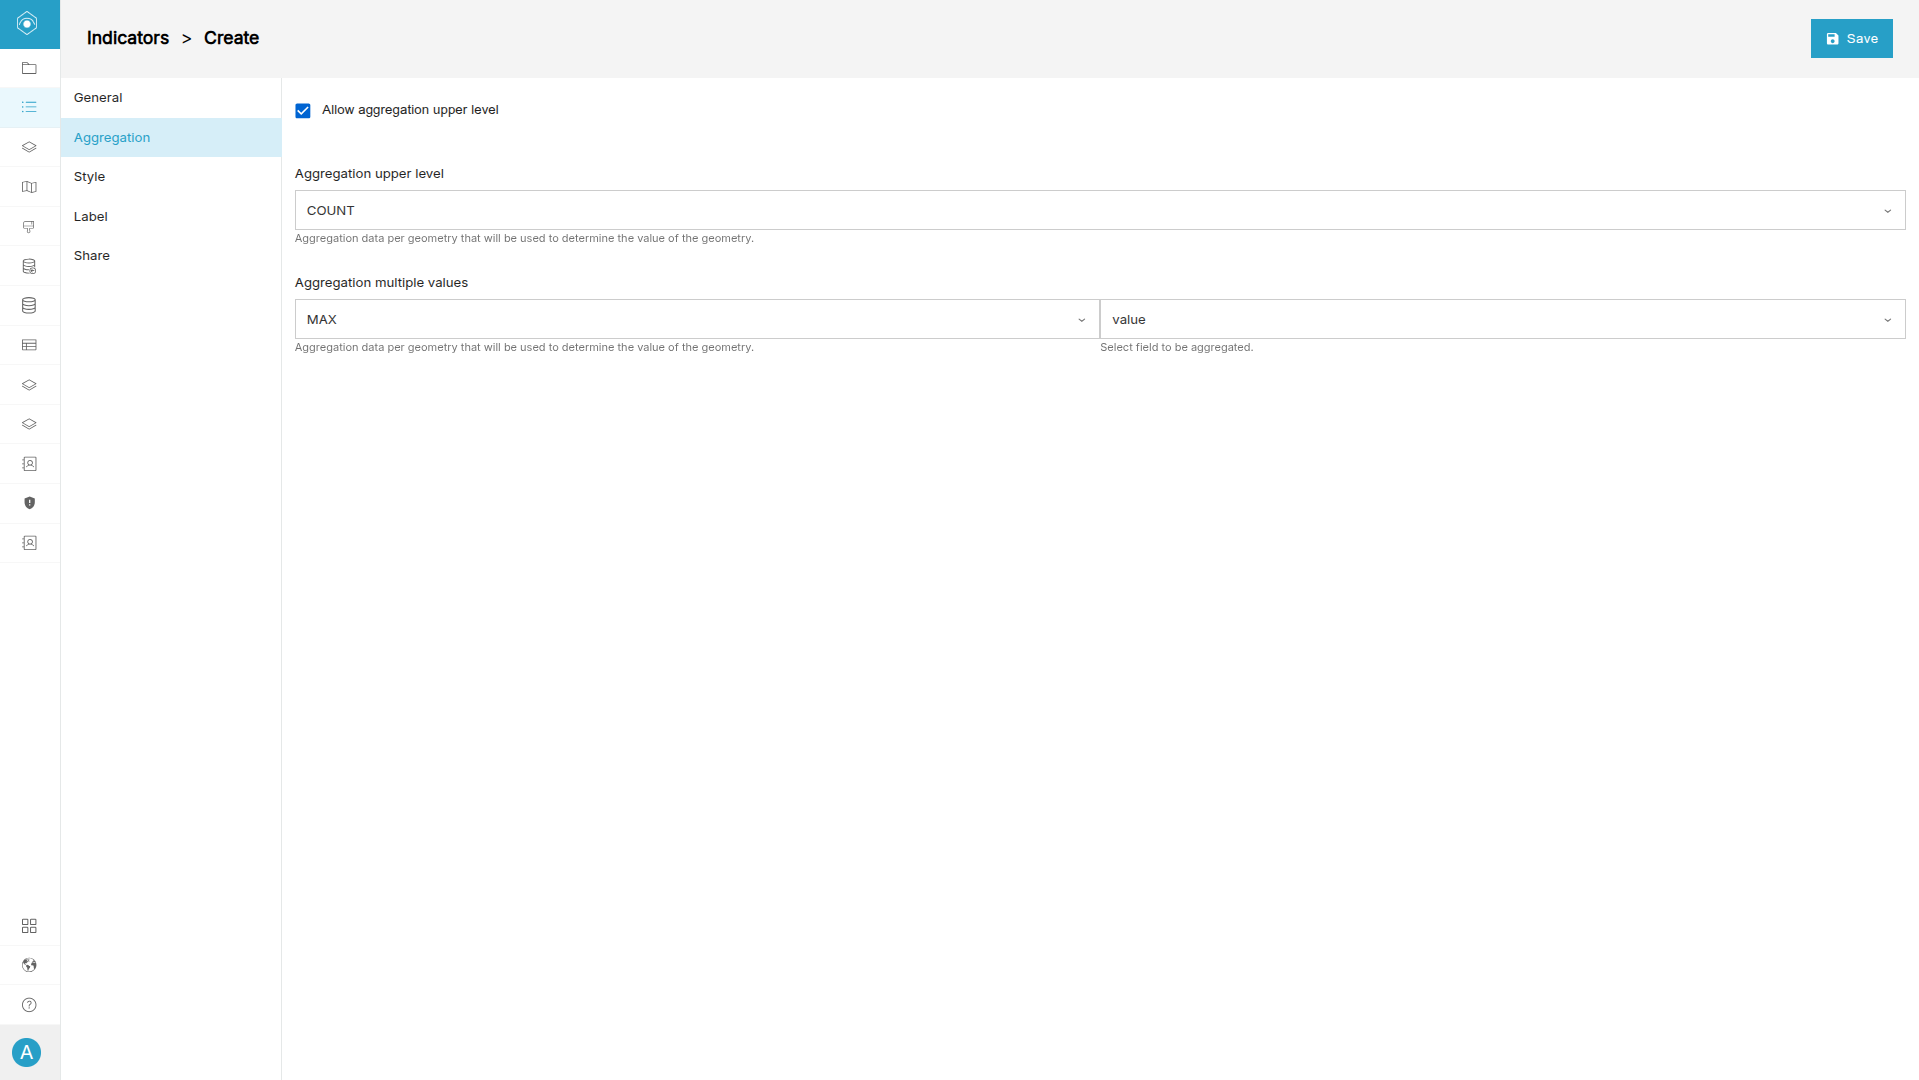
Aggregation settings control how lower administrative data is summarized into higher administrative levels.
-
Open the Aggregation tab.
-
Enable Allow aggregation upper level if required.
-
Select the preferred aggregation method.
| Aggregation Type | Description |
|---|---|
| COUNT | Counts the number of available records or sub-districts. |
| SUM | Calculates the total combined value. |
| AVG | Calculates the average value. |
| MAX | Returns the highest value. |
| MIN | Returns the lowest value. |
Step 4: Configure Indicator Styles
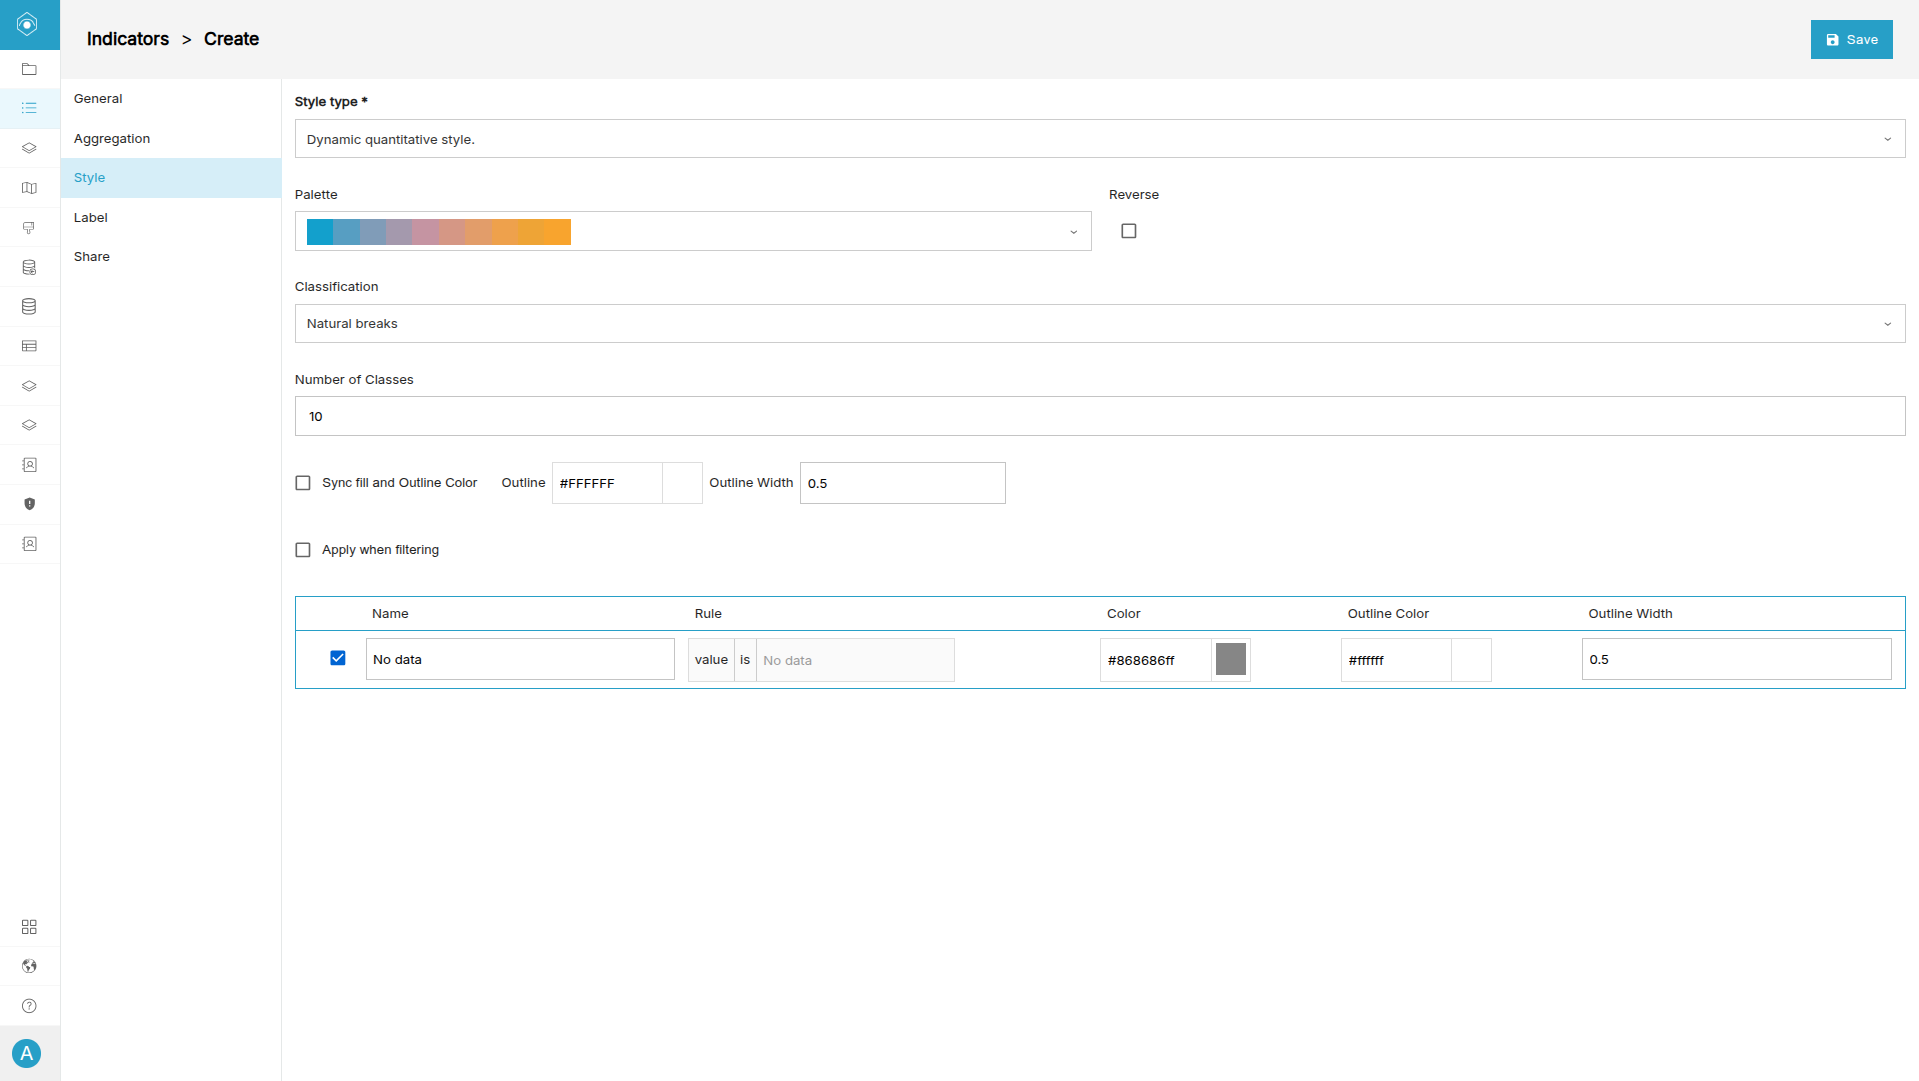
Styles determine how the indicator is visualized on the map.
-
Open the Style tab.
-
Select a style type or predefined style.
-
Choose a colour palette.
-
Configure classifications and class counts.
-
Save the style settings.
| Style Option | Description |
|---|---|
| Palette | Select a predefined colour palette. |
| Reverse Palette | Reverse the order of colours. |
| Classification | Define how values are grouped into classes. |
| Number of Classes | Set the number of map classes. |
| Outline Styling | Configure polygon outlines and border colours. |
Step 5: Configure Labels
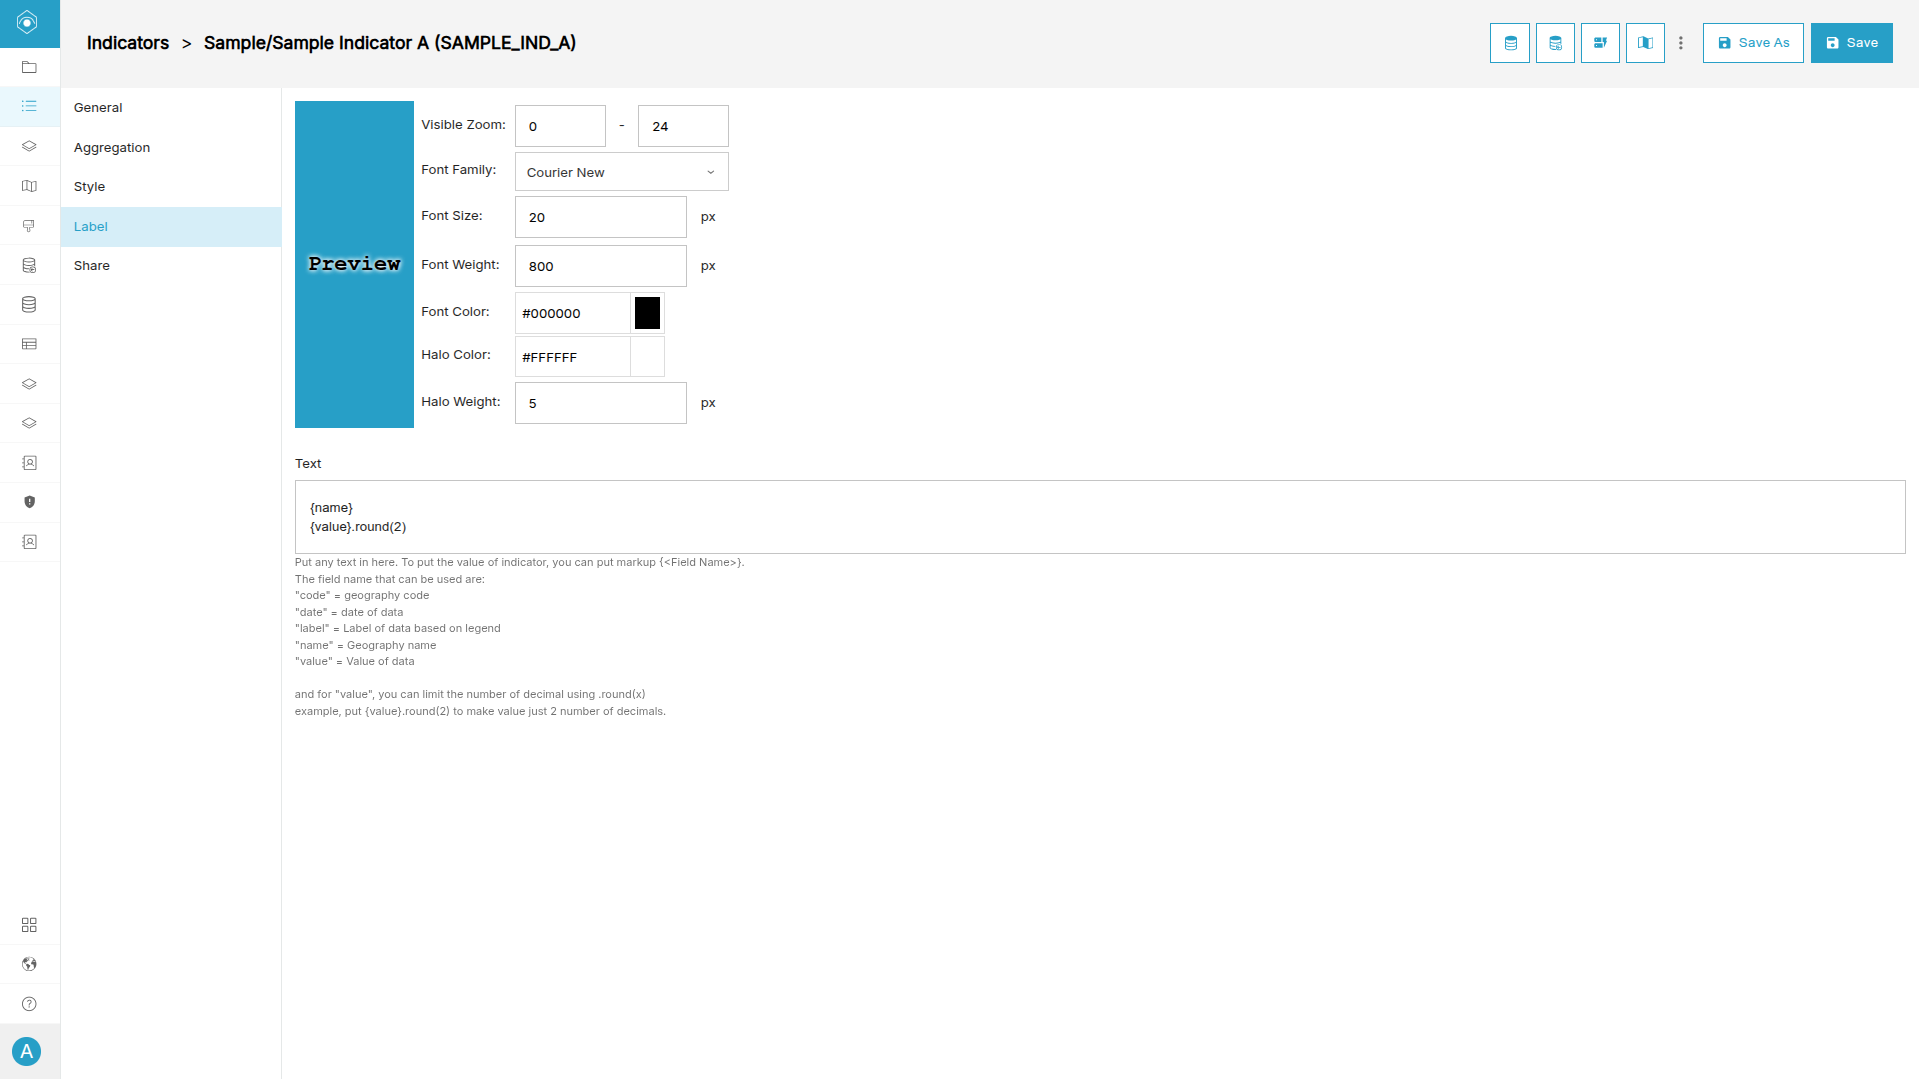
Labels allow values and metadata to appear directly on administrative boundaries in the map view.
-
Open the Label tab.
-
Configure the label text format.
-
Adjust font styling, size, colour, and halo settings.
-
Save the label configuration.
Available label variables include:
- {name} — Geography name
- {value} — Indicator value
- {date} — Observation date
- {code} — Geography code
- {label} — Classification label
Additional Indicator Operations
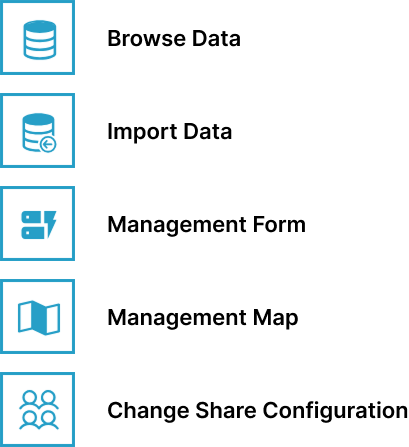
GeoSight provides several additional tools directly from the Indicators table.
| Operation | Description |
|---|---|
| Browse Data | View and manage imported indicator records. |
| Import Data | Upload new indicator observations. |
| Management Form | Configure forms and attribute settings. |
| Management Map | Configure map-related management tools. |
| Change Share Configuration | Manage access permissions for indicator data. |
Next up: Learn how to import Indicator Data into GeoSight using Excel files, reference datasets, and time-enabled data configurations.